Avicenna Journal of Clinical Microbiology and Infection. 12(1):34-42.
doi: 10.34172/ajcmi.3523
Original Article
Biosynthesis of Silver Nanoparticles Using a Combination of Aqueous Extracts of Allium sativum and Peganum harmala and Evaluating Its Effect Against Some Fungi Causing Superficial Fungal Infections
Masoumeh Karimi Data curation, Formal analysis, Investigation, Methodology, Project administration, Resources, Software, Validation, Writing – original draft, Writing – review & editing, 1 
Khosrow Chehri Conceptualization, Data curation, Investigation, Methodology, Project administration, Supervision, Validation, Writing – original draft, Writing – review & editing, 1, *
Sajad Moradi Conceptualization, Data curation, Formal analysis, Investigation, Methodology, Project administration, Software, Validation, 2
Mohsen Shahlaei Project administration, 2
Author information:
1Department of Biology, Faculty of Sciences, Razi University, Kermanshah, Iran
2Nano Drug Delivery Research Center, Health Technology Institute, Kermanshah University of Medical Sciences, Kermanshah, Iran
Abstract
Background: Due to concerns about microorganisms’ widespread resistance, the development of new therapeutic approaches for combating pathogenic microbes is necessary. This study aimed to synthesize silver nanoparticles (AgNPs) using a composition of Allium sativum and Peganum harmala extracts and to investigate their biological activity against fungal species causing dermatophyte disease.
Methods: The characterization of the biosynthesized AgNPs was performed using ultraviolet-visible (UV-Vis) spectroscopy, dynamic light scattering (DLS), X-ray diffraction (XRD), energy-dispersive X-ray analysis (EDAX), scanning electron microscopy (SEM), and Fourier-transform infrared spectroscopy (FTIR). The antifungal effect of AgNPs was assessed using the microdilution method against pathogenic fungi, including Candida albicans, Microsporum canis, and Trichophyton rubrum. Data were finally analyzed using SPSS software.
Results: SEM analysis revealed AgNPs had a spherical shape with a size range of 40-45 nanometers. The biosynthesized nanoparticles showed significant antifungal effect, with minimum inhibitory concentration on T. rubrum, M. canis, and C. albicans reported to be 7, 31, and 15 µg/mL respectively (P≤0.05).
Conclusion: The results demonstrated that AgNPs synthesized using a mixture of A. sativum and P. harmala extracts exhibit significant antifungal effects against skin-related infectious fungi, suggesting their potential use as therapeutic agents in such infections.
Keywords: Medical plants, Metal nanoparticles, Antifungal effect
Copyright and License Information
© 2025 The Author(s); Published by Hamadan University of Medical Sciences.
This is an open-access article distributed under the terms of the Creative Commons Attribution License (
https://creativecommons.org/licenses/by/4.0), which permits unrestricted use, distribution, and reproduction in any medium, provided the original work is properly cited.
Please cite this article as follows: Karimi M, Chehri K, Moradi S, Shahlaei M. Biosynthesis of silver nanoparticles using a combination of aqueous extracts of Allium sativum and Peganum harmala and evaluating its effect against some fungi causing superficial fungal infections. Avicenna J Clin Microbiol Infect. 2025;12(1):34-42. doi:10.34172/ajcmi.3523
Introduction
Fungal skin infections are caused by a group of fungi, including dermatophytes, Candida, and Malassezia (1). Dermatophytosis, or ringworm, is a common fungal skin disease caused by dermatophytes. It is globally distributed and is important from a public health perspective. Dermatophytosis is among the common diseases shared between humans and animals (2). Keratinophilic fungi such as Trichophyton, Microsporum, and Epidermophyton may cause dermatophytosis (3). Candida albicans is a common yeast responsible for opportunistic fungal diseases worldwide. It typically causes oral thrush, skin infections, and vaginal fungal infections. Candida is a part of the natural flora of the skin, mouth, vagina, and mucous membranes of the human digestive tract (4).
Over time, the misuse and overuse of antibiotics in humans and animals have not only significantly increased treatment costs but also contributed to a growing trend of microbial resistance worldwide. Today, humans face two major challenges: the rise in microbial resistance and the time-consuming process required to develop new antibiotics (5). One of the most promising solutions to these complications is the use of metal nanoparticles (NPs) (6).
Nanotechnology is the science of manipulating and rearranging atoms to create useful materials, tools, and systems at the nanometer scale (6,7). As particle size reaches the nanoscale, new physical and chemical properties emerge in the materials (7). Silver nanoparticles (AgNPs) possess a high surface area with the environment and organisms, which leads to an increase in their biological and chemical activity. This feature is attributed to the small size and high surface-to-volume ratio of NPs (8).
Recently, various techniques have been utilized for the biosynthesis of AgNPs, including biological, chemical, and physical methods (8). Among these, the use of biological techniques such as plant extracts has attracted considerable attention due to their simplicity, non-toxicity, environmental friendliness, low cost, and high efficiency compared to other methods (9-13).
Allium sativum is a perennial plant from the Amaryllidaceaefamily. It contains various minerals, vitamins, flavonoids, and both volatile and non-volatile compounds and has long been used for therapeutic purposes by humans (14). Another medicinal plant, Peganum harmala, belongs to the Zygophyllaceae family. Its seeds contain 2 to 6% active pharmaceutical alkaloids, most of which are beta-carboline compounds, including harmane, harmine, harmaline, and harmalol (11,15,16). This study aimed to synthesize AgNPs using a composition of A. sativum and P. harmala extracts and to evaluate the antifungal effect of biosynthesized AgNPs on fungi Microsporum canis, Trichophyton rubrum, and C. albicans.
Materials and Methods
Procurement of Materials
Allium sativum and P. harmala were collected in the spring from Lorestan Province, Iran. The plants were carefully harvested, identified, and stored under appropriate conditions. High-purity silver nitrate (AgNO3) was purchased from Merck (Germany). Standard fungal strains of C. albicans (PTCC5027, ATCC10231), T. rubrum (PTCC143, R613), and M. canis (PTCC5069) were obtained from the Iranian Research Organization for Science and Technology (IROST) and prepared according to CLSI standards (M27 for Candida and M38 for Trichophyton and Microsporum) for antimicrobial susceptibility testing.
Preparation of Plant Extracts and Biosynthesis of Silver Nanoparticles
Roots and seeds of P. harmala and A. sativum were prepared and dried. The dried plants were pulverized, and 5 grams of each was mixed with 100 mL of boiling water. The compound was boiled for 10 minutes and then cooled and centrifuged at 5000 rpm for 10 minutes to remove suspended particles. The obtained solutions were then purified twice using Whatman filter paper. The plant extracts were sterilized using a 0.2 µm syringe filter. The extracts prepared for the experiments were kept at 4 °C.
A combined solution of A. sativum and P. harmala extracts was prepared in a ratio of 30:70. Specifically, 10 mL (containing 7 mL of A. sativum and 3 mL of P. harmala extract 2000 ppm) was mixed with 90 mL of an aqueous AgNO3 solution at a concentration of 0.01 M. The final mixture was exposed to sunlight for 10 minutes until a color change was observed. The color change to light brown indicated the reduction of Ag⁺ ions to AgNPs. Then, the mixture was centrifuged at 12 000 rpm for 10 minutes to separate the NPs from unreacted materials. The resulting sediment was washed twice and stored at 4°C after freeze-drying.
Characterization of Silver Nanoparticles
The synthesis of AgNPs was confirmed using a UV-visible spectrometer (Agilent UV-vis). An absorption peak in the range of 400-450 nm confirmed the formation of AgNPs in the reaction mixture.Scanning electron microscopy (SEM) was utilized to assess the size and morphology, and the energy-dispersive X-ray spectroscopy (EDAX) was employed for elemental analysis of biosynthesized AgNPs. Fourier transform infrared spectroscopy (FTIR) was used to identify the chemical composition and functional groups in the aqueous extracts responsible for capping the silver NPs. To determine the crystalline structure of AgNPs, X-ray diffraction (XRD) analysis was employed. The dried powder of AgNPs was analyzed by XRD using CuKα radiation with a scan angle (2θ) range of 10° to 80°. The size distribution and uniformity of biosynthesized AgNPs were confirmed by dynamic light scattering (DLS) spectroscopy.
Antifungal Activity Assay of Silver Nanoparticles
Antifungal activity of synthesized AgNPs was evaluated at different concentrations (500, 250, 125, 62, 31, 15, and 7 µg/mL) using agar dilution, broth microdilution, and fungal disk growth inhibition methods.
Preparation of Fungal Suspension
According to CLSI standards (M38 for T. rubrum and M. canis and M27 for C. albicans), fungal suspensions were prepared for antimicrobial susceptibility testing as follows: C. albicans, T. rubrum, and M. canis were separately cultured on Potato Dextrose Agar at 35°C for C. albicans (24–48 hours) and at 28–30 °C for M. canis and T. rubrum (7–14 days) to allow for the development of visible colonies (17). Following incubation, well-isolated colonies of uniform size and morphology were carefully picked using a sterile loop from the surface of the agar. C. albicans colonies were suspended in 5 mL of 0.85% NaCl solution, while M. canis and T. rubrum were transferred into 10 mL of saline solution containing 0.05% Tween 80. The resulting suspensions were then thoroughly vortexed for 30 seconds to ensure homogeneity. For filamentous fungi (M. canis and T. rubrum), the suspension was filtered through a 0.45 µm membrane filter to remove large hyphal fragments, leaving only conidia. Turbidity of the suspension was measured using a spectrophotometer at 530 nm, and suspensions were diluted to a final concentration of 1.5 × 10³ CFU/mL for antimicrobial susceptibility testing.
Determination of Minimum Inhibitory Concentration Using Broth Microdilution
The minimum inhibitory concentration (MIC) of AgNPs against T. rubrum, M. canis, and C. albicans was measured using the broth microdilution technique, according to CLSI guidelines (M38-A2 for filamentous fungi and M27-A3 for yeasts) (18). For each fungal species, four rows of a microplate were designated, and 100 μL of Potato Dextrose Broth was transferred to each well. In the first well of each row, 100 μL of AgNP solution (500 µg/mL) was added. The contents of the first well were combined, and 100 μL was taken from the first well and transferred to the second well. This serial dilution process continued until well number 7, from which 100μL was discarded. Next, 10 µL of the standardized fungal suspension was added to each well.
Well 8 was considered a positive control (containing culture medium and bacteria sample), while row 4 (containing different concentrations of AgNPs and culture medium) served as a negative control. Optical absorption of all wells was measured using an ELISA reader at 630 nm, followed by incubation at 28 °C for 48 hours for C. albicans and one week for T. rubrum and M. canis. After inhibition, a secondary absorption was taken, and finally, primary and secondary absorptions were compared. A well with almost the same primary and secondary optical absorbance was determined as the MIC. To determine the minimum fungicidal concentration (MFC), the contents of two wells before and two wells after the MIC well were cultured and incubated. The MFC100 was defined as the lowest concentration of AgNPs capable of killing 99.9% of the fungal cells.
Inhibition of Fungal Disc Growth Using the Agar Dilution Method
The agar dilution method was used to evaluate the antifungal activity of AgNPs and the combined extract of P. harmala and A. sativum. Different concentrations of NPs (7, 15, 31, 62, 125, 250, and 500 µg/mL) and a 2000 µg/mL solution of the combined extract of P. harmala and A. sativum were prepared. These solutions were then mixed with Potato Dextrose Agar (PDA) at a 1:2 ratio, ensuring uniform dispersion of the NPs and plant extract throughout the medium.
Fungal discs (6 mm in diameter) were obtained from cultures of C. albicans, T. rubrum, and M. canis and placed at the center of the plates. In this experiment, plates containing only culture medium and fungus served as negative controls, while plates treated with the antifungal drug fluconazole served as positive controls.
Once fungal mycelium on the control plate (without AgNPs) reached the edge of the plate, the growth rate of the fungal discs in the treated plates was measured using a ruler. The experiment was repeated three times for each fungus. Then, the percentage of growth inhibition was measured using the formula:
Inhibition rate% = (R-r) / R × 100,
where R is the growth radius in the control plate and r is the growth radius in the experimental group (19).
Results
The first indication of reduction of Ag + to AgNPs (Ago) using the combined extract of P. harmala and A. sativum was observed by the initial color change in the reaction mixture. Within 15 minutes, the reaction mixture changed from pale yellow to light brown, which was an indicator of NP synthesis (Figure 1). Discoloration of the solution containing NPs is one of the signs of NP synthesis that is associated with the reduction of Ag + ions to AgNPs.
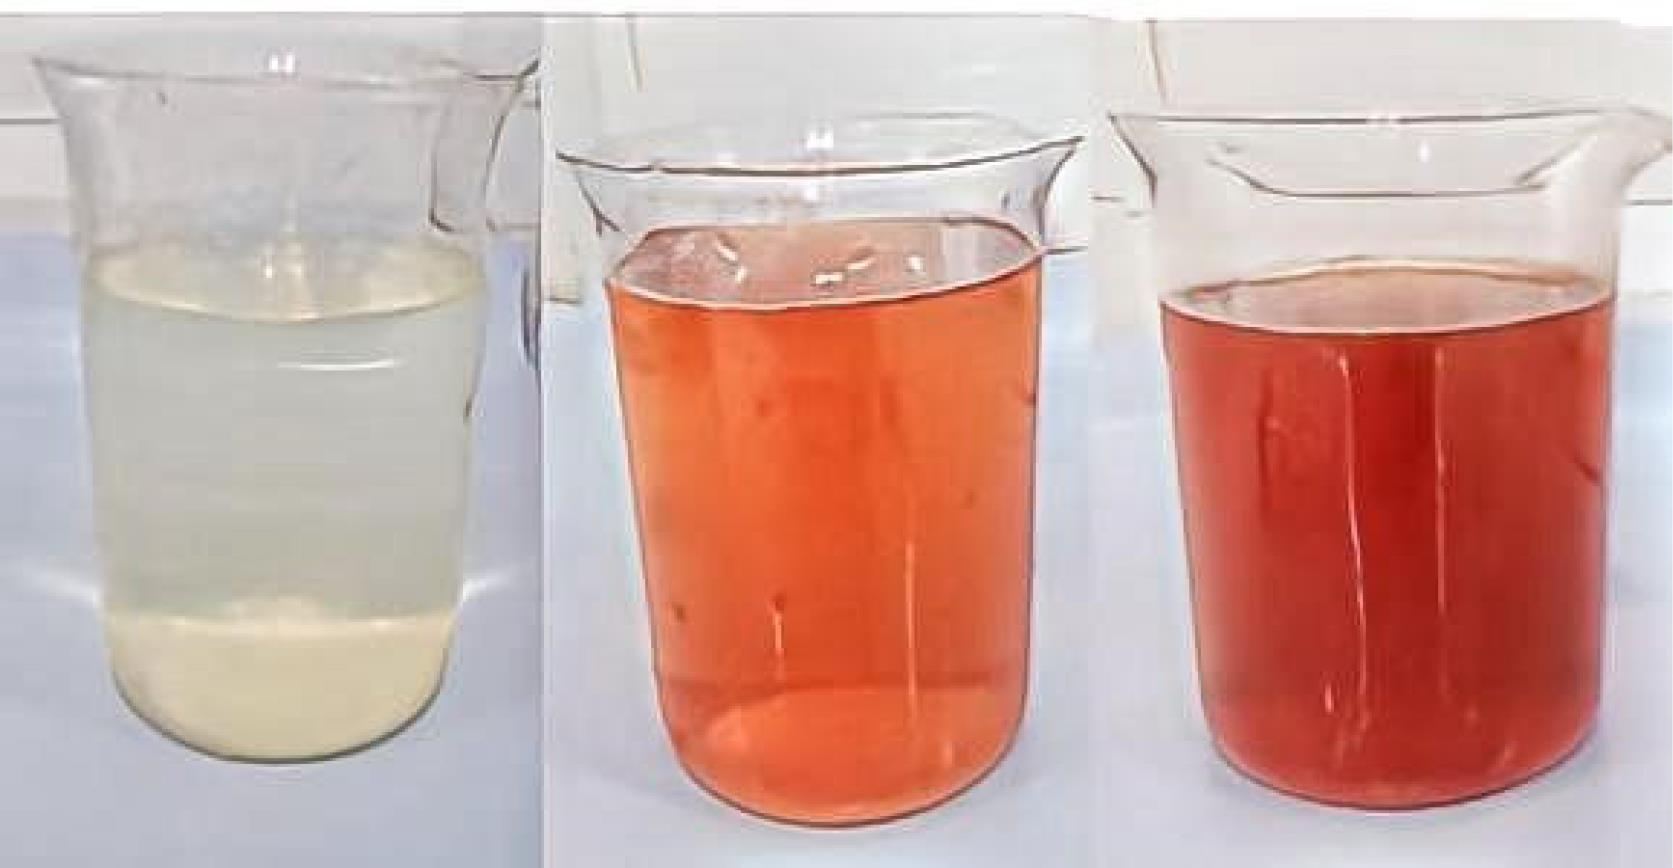
Figure 1.
Color Change in the Extract and Silver Nitrate After Incubation
.
Color Change in the Extract and Silver Nitrate After Incubation
A spectroscopic technique was used to ensure the formation and stability of the synthesized AgNPs. The biosynthesized AgNPs in this study reached an absorption peak at 450 nm (Figure 2). The presence of only one sharp adsorption peak in the diagram indicates the monodispersity and uniform distribution of biosynthesized NPs.
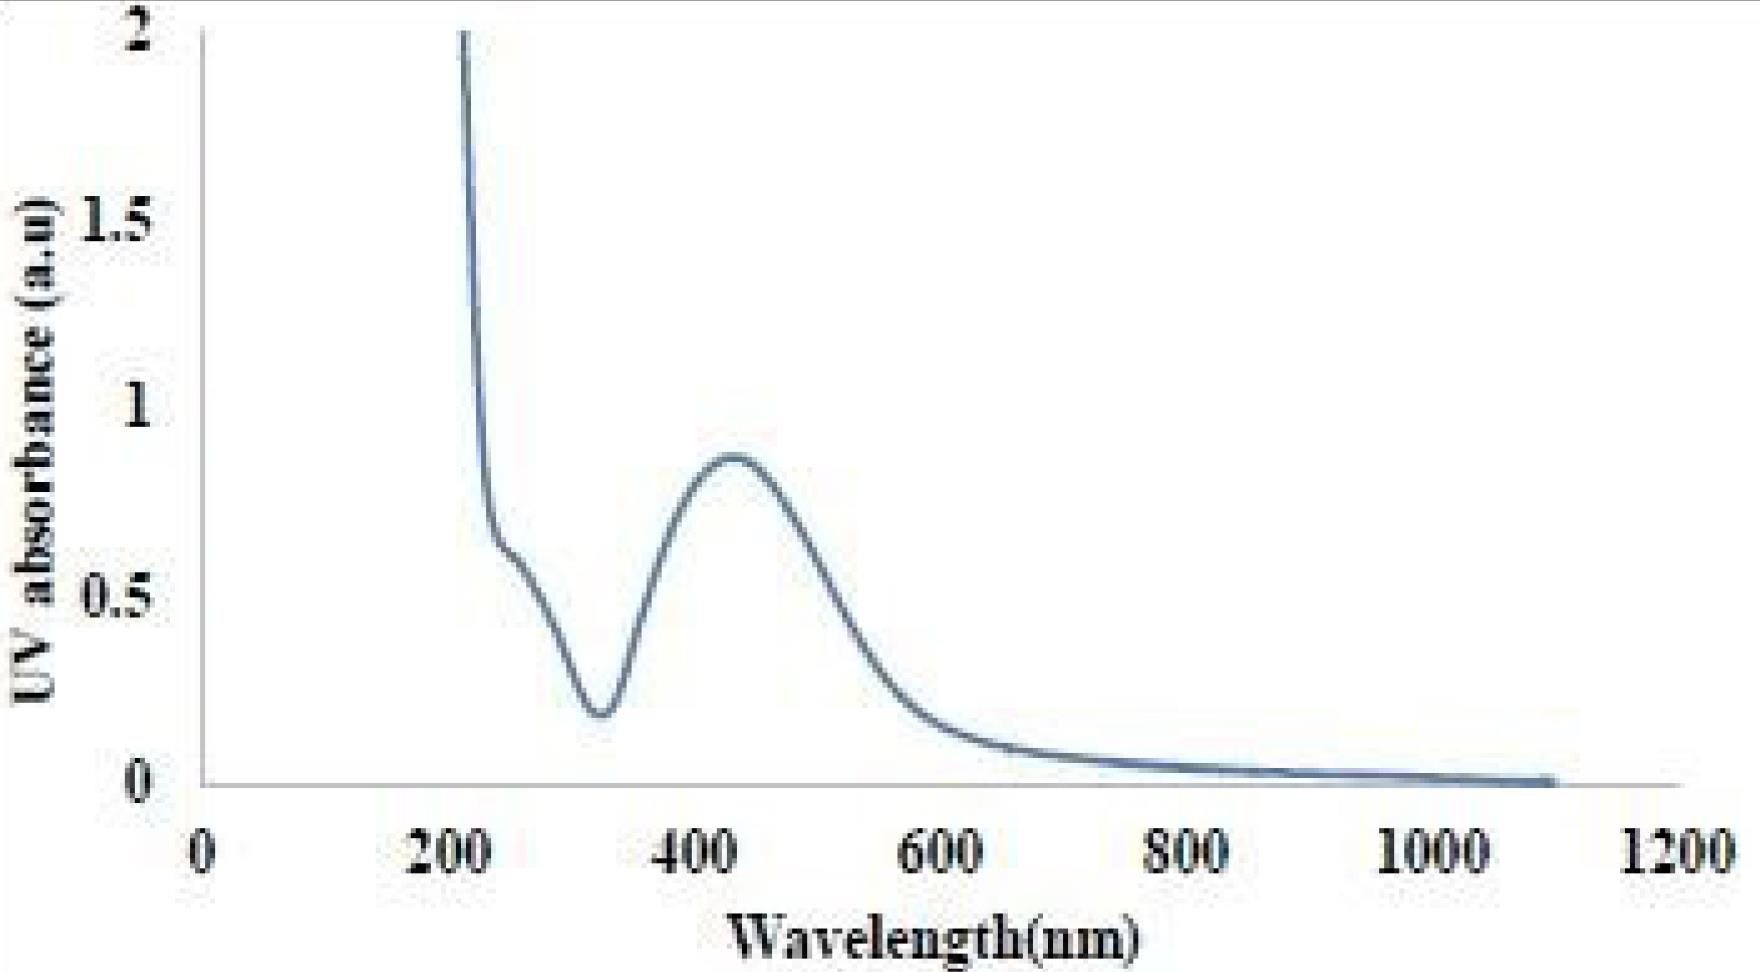
Figure 2.
UV–Vis Absorption Spectra of Synthesized Silver Nanoparticles
.
UV–Vis Absorption Spectra of Synthesized Silver Nanoparticles
XRD was used to examine the crystal structure of the synthesized AgNPs. The XRD pattern confirmed the formation of AgNPs in the reaction mixture. The XRD spectrum showed intense peaks related to the crystal planes (1 1 1), (2 0 0), (2 0 2), and (3 1 1) according to Bragg’s law (Figure 3).
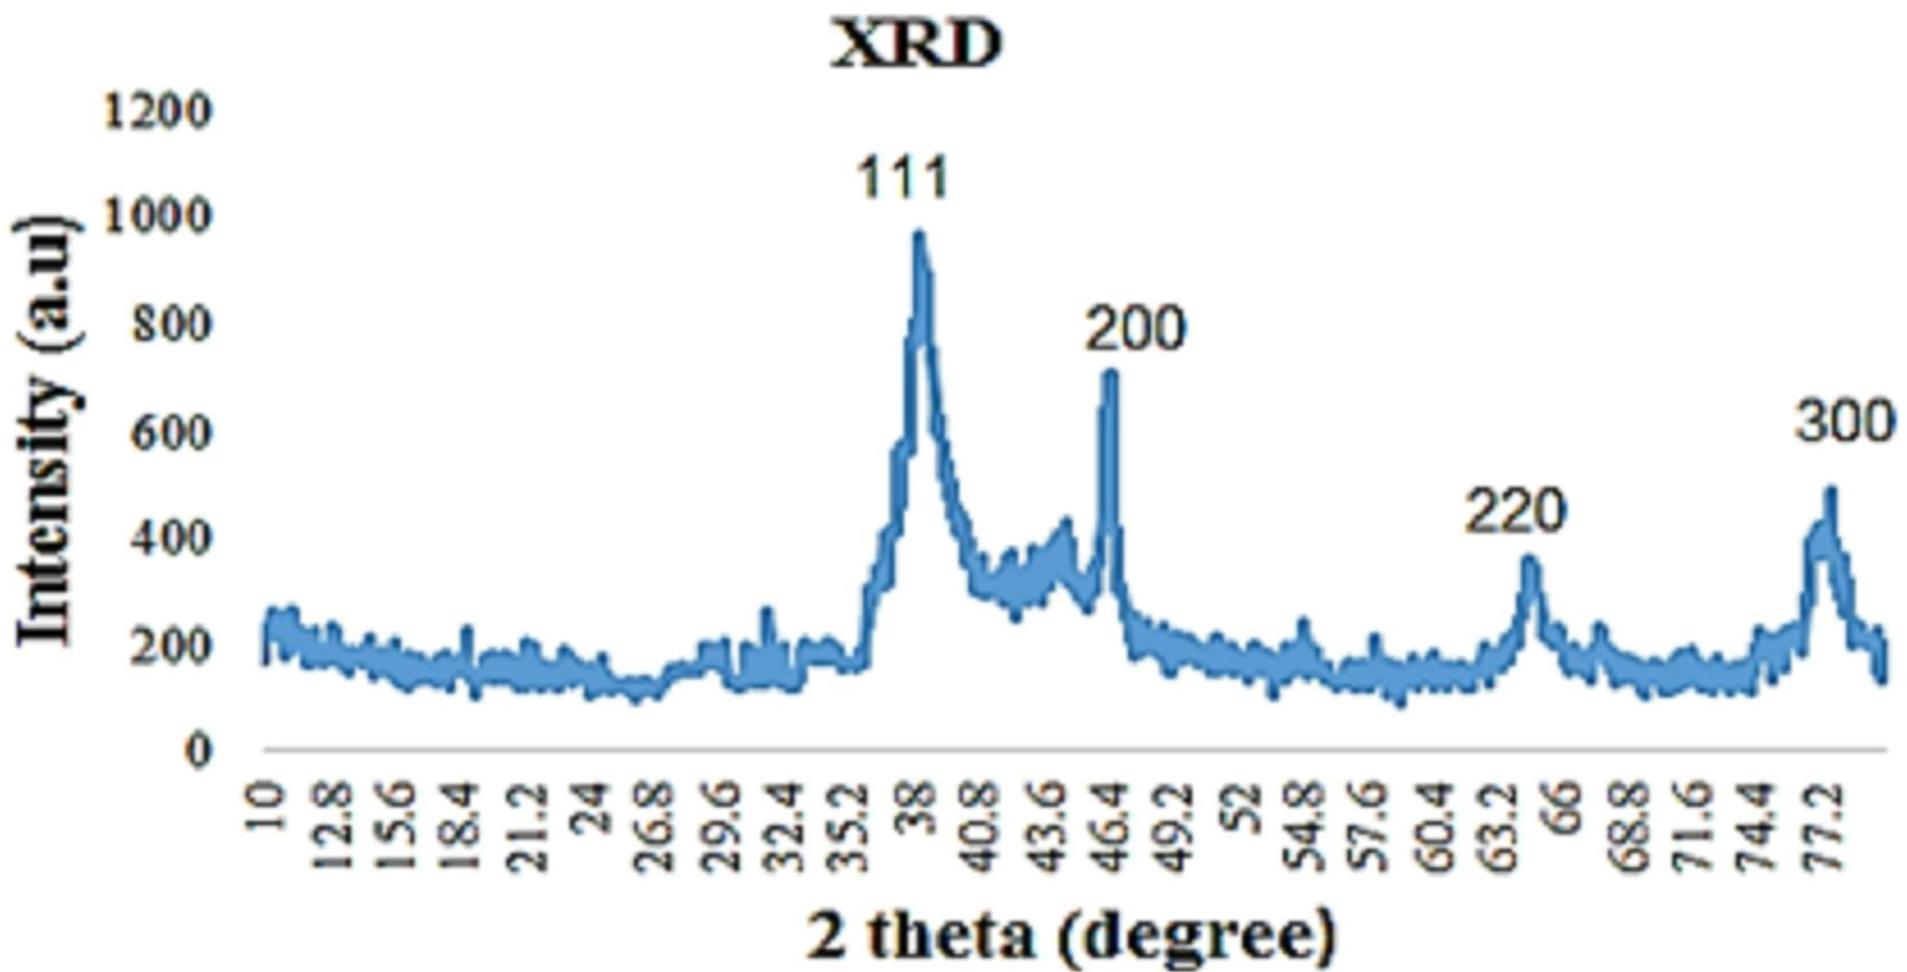
Figure 3.
XRD Pattern of Synthesized Silver Nanoparticles. Note. XRD: X-ray diffraction
.
XRD Pattern of Synthesized Silver Nanoparticles. Note. XRD: X-ray diffraction
FTIR analysis was used to detect plant biological compounds that reduce and stabilize silver ions. Surface functional groups on the NPs act as reducers and coatings for the NPs. As shown in Figure 4, peaks at 3471.74 and 3418.02 cm−1 may indicate the presence of the OH functional group or phenolic compounds. The peak at 1637.43 cm−1 can be related to C = O, while the peak at 1618.89 cm−1 is related to NH2. Peaks at 2005 and 1322 cm−1 are attributed to alkane C-H or CH3 groups and aromatic groups. Additional peaks were observed at 1095 cm−1 (C-O-C), 776 cm−1 (PO), and 620 cm−1 (amide N-H).
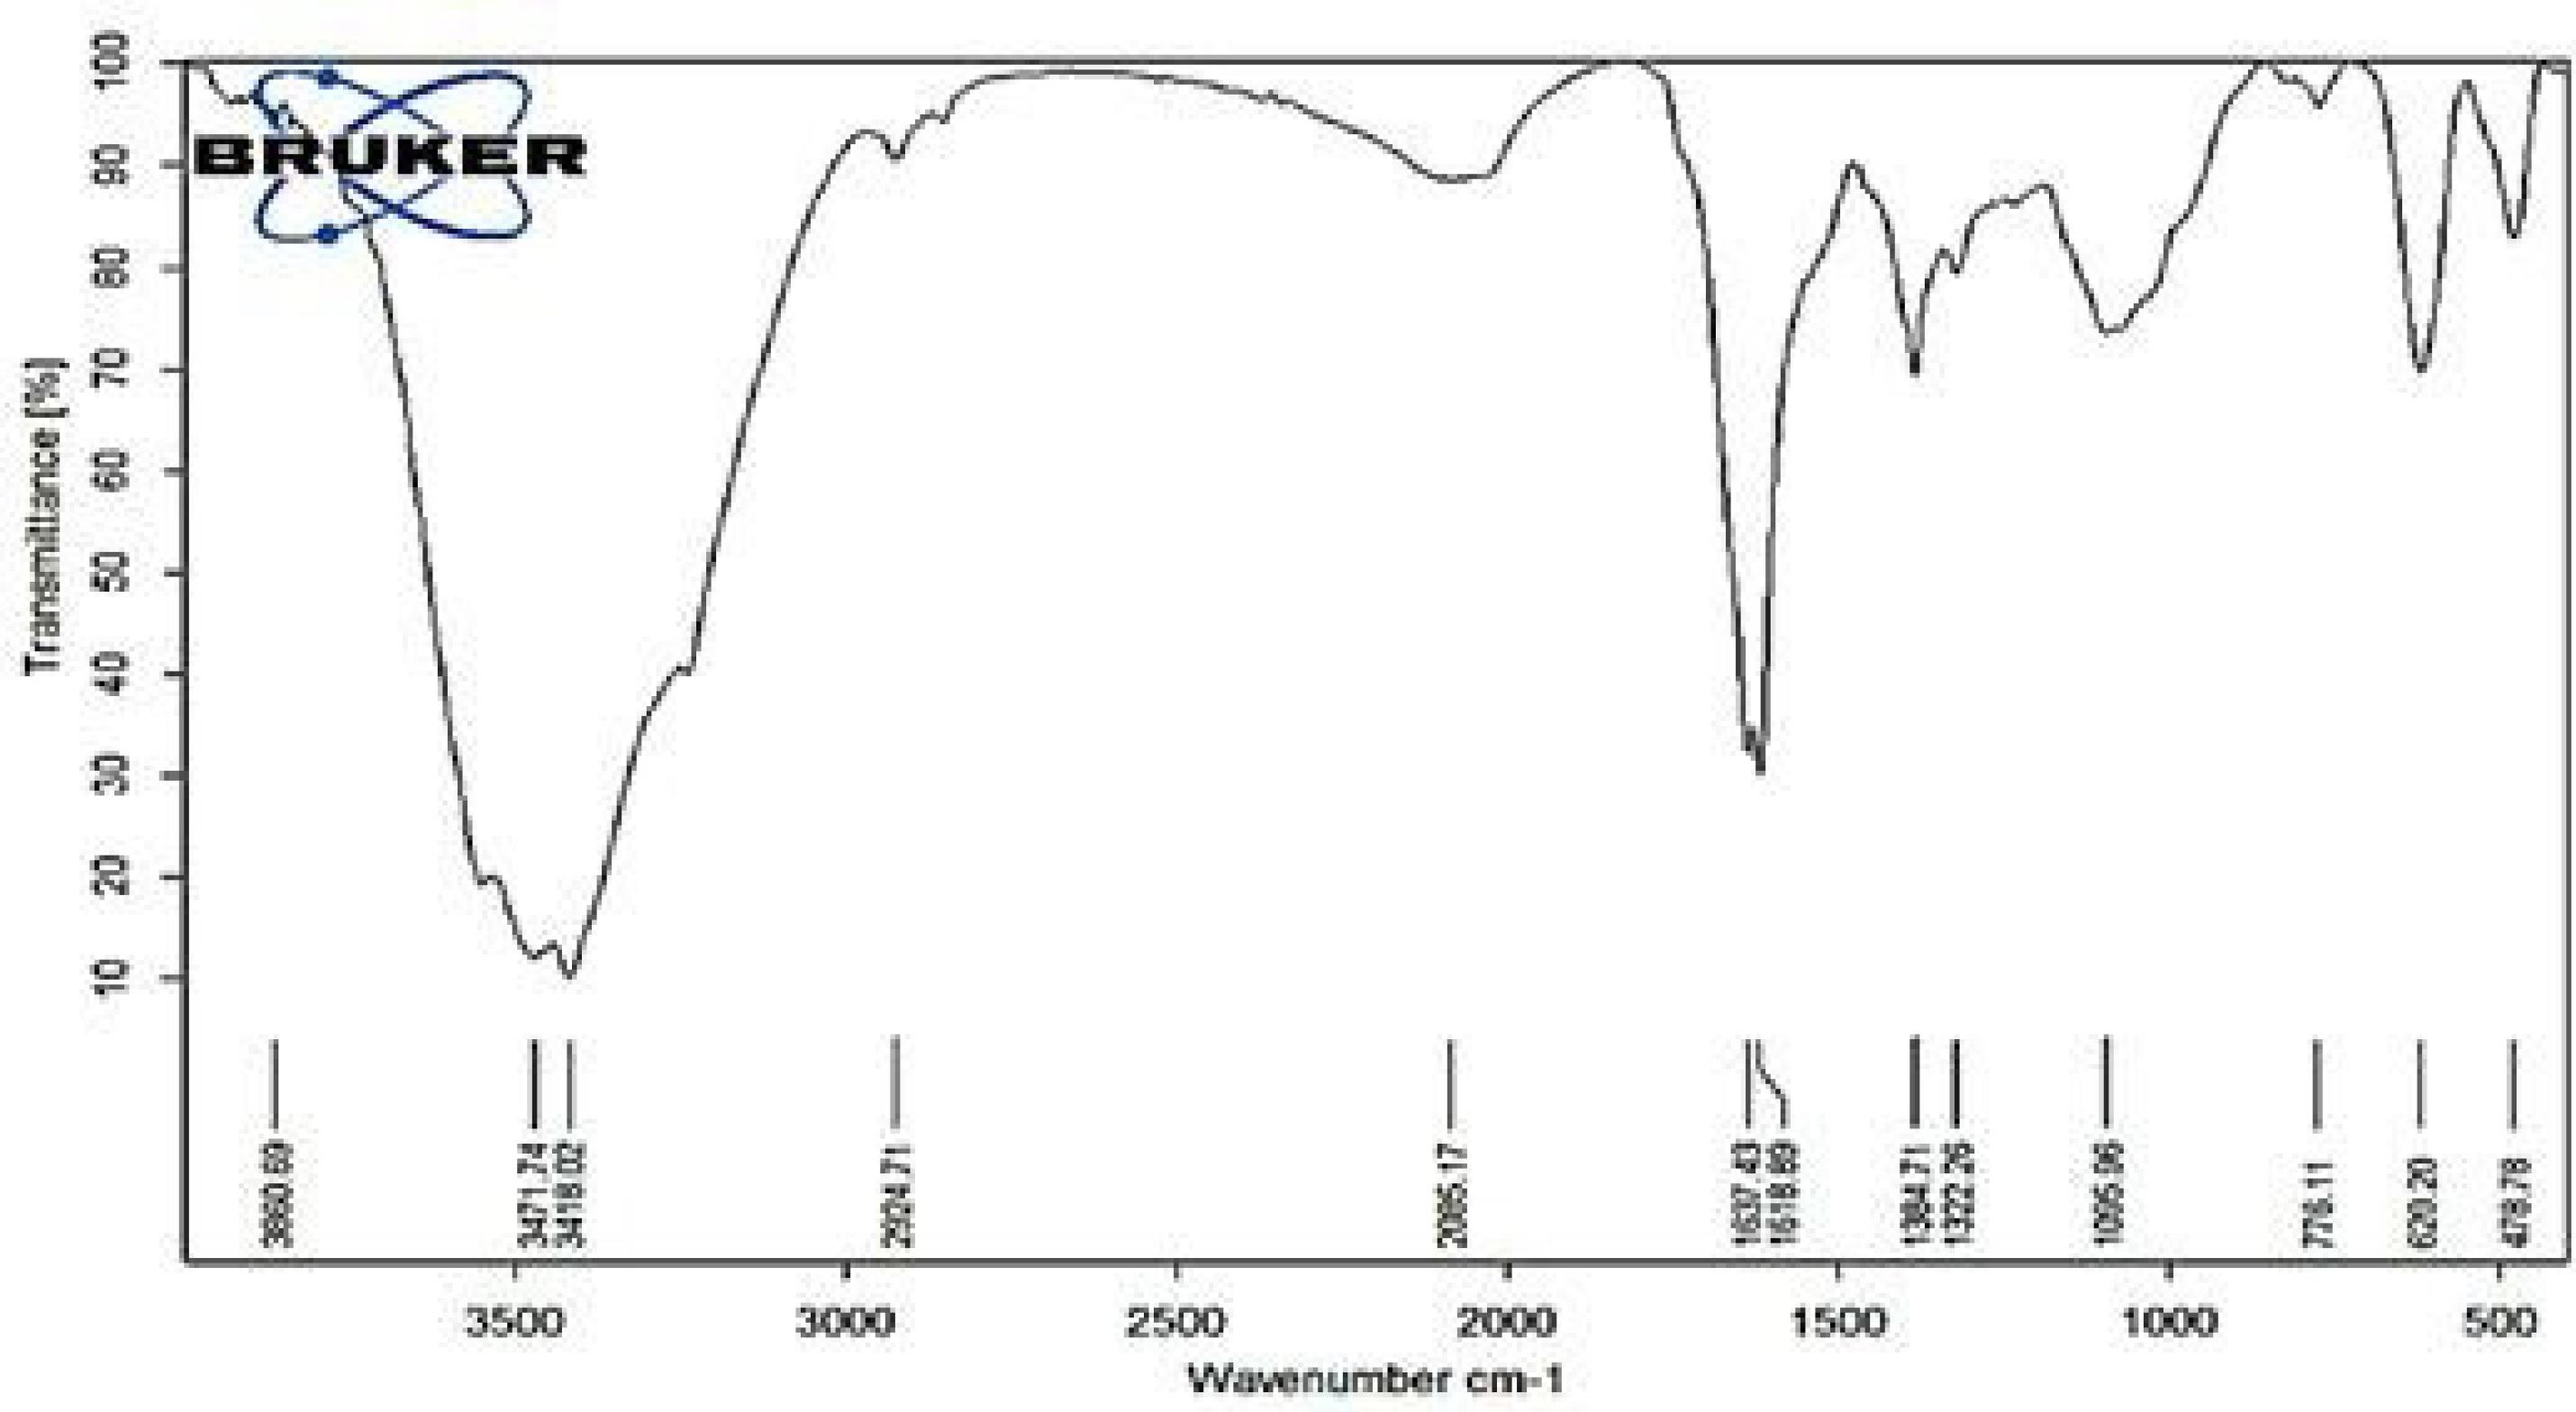
Figure 4.
Fourier-Transform Infrared Spectroscopy Spectra of Synthesized Silver Nanoparticles
.
Fourier-Transform Infrared Spectroscopy Spectra of Synthesized Silver Nanoparticles
The morphology and size of NPs synthesized by P. harmala and A. sativum extracts were investigated using SEM (Figure 5). According to the obtained image, the synthesized AgNPs were spherical in shape, with an average size of 40 ± 5 nm.
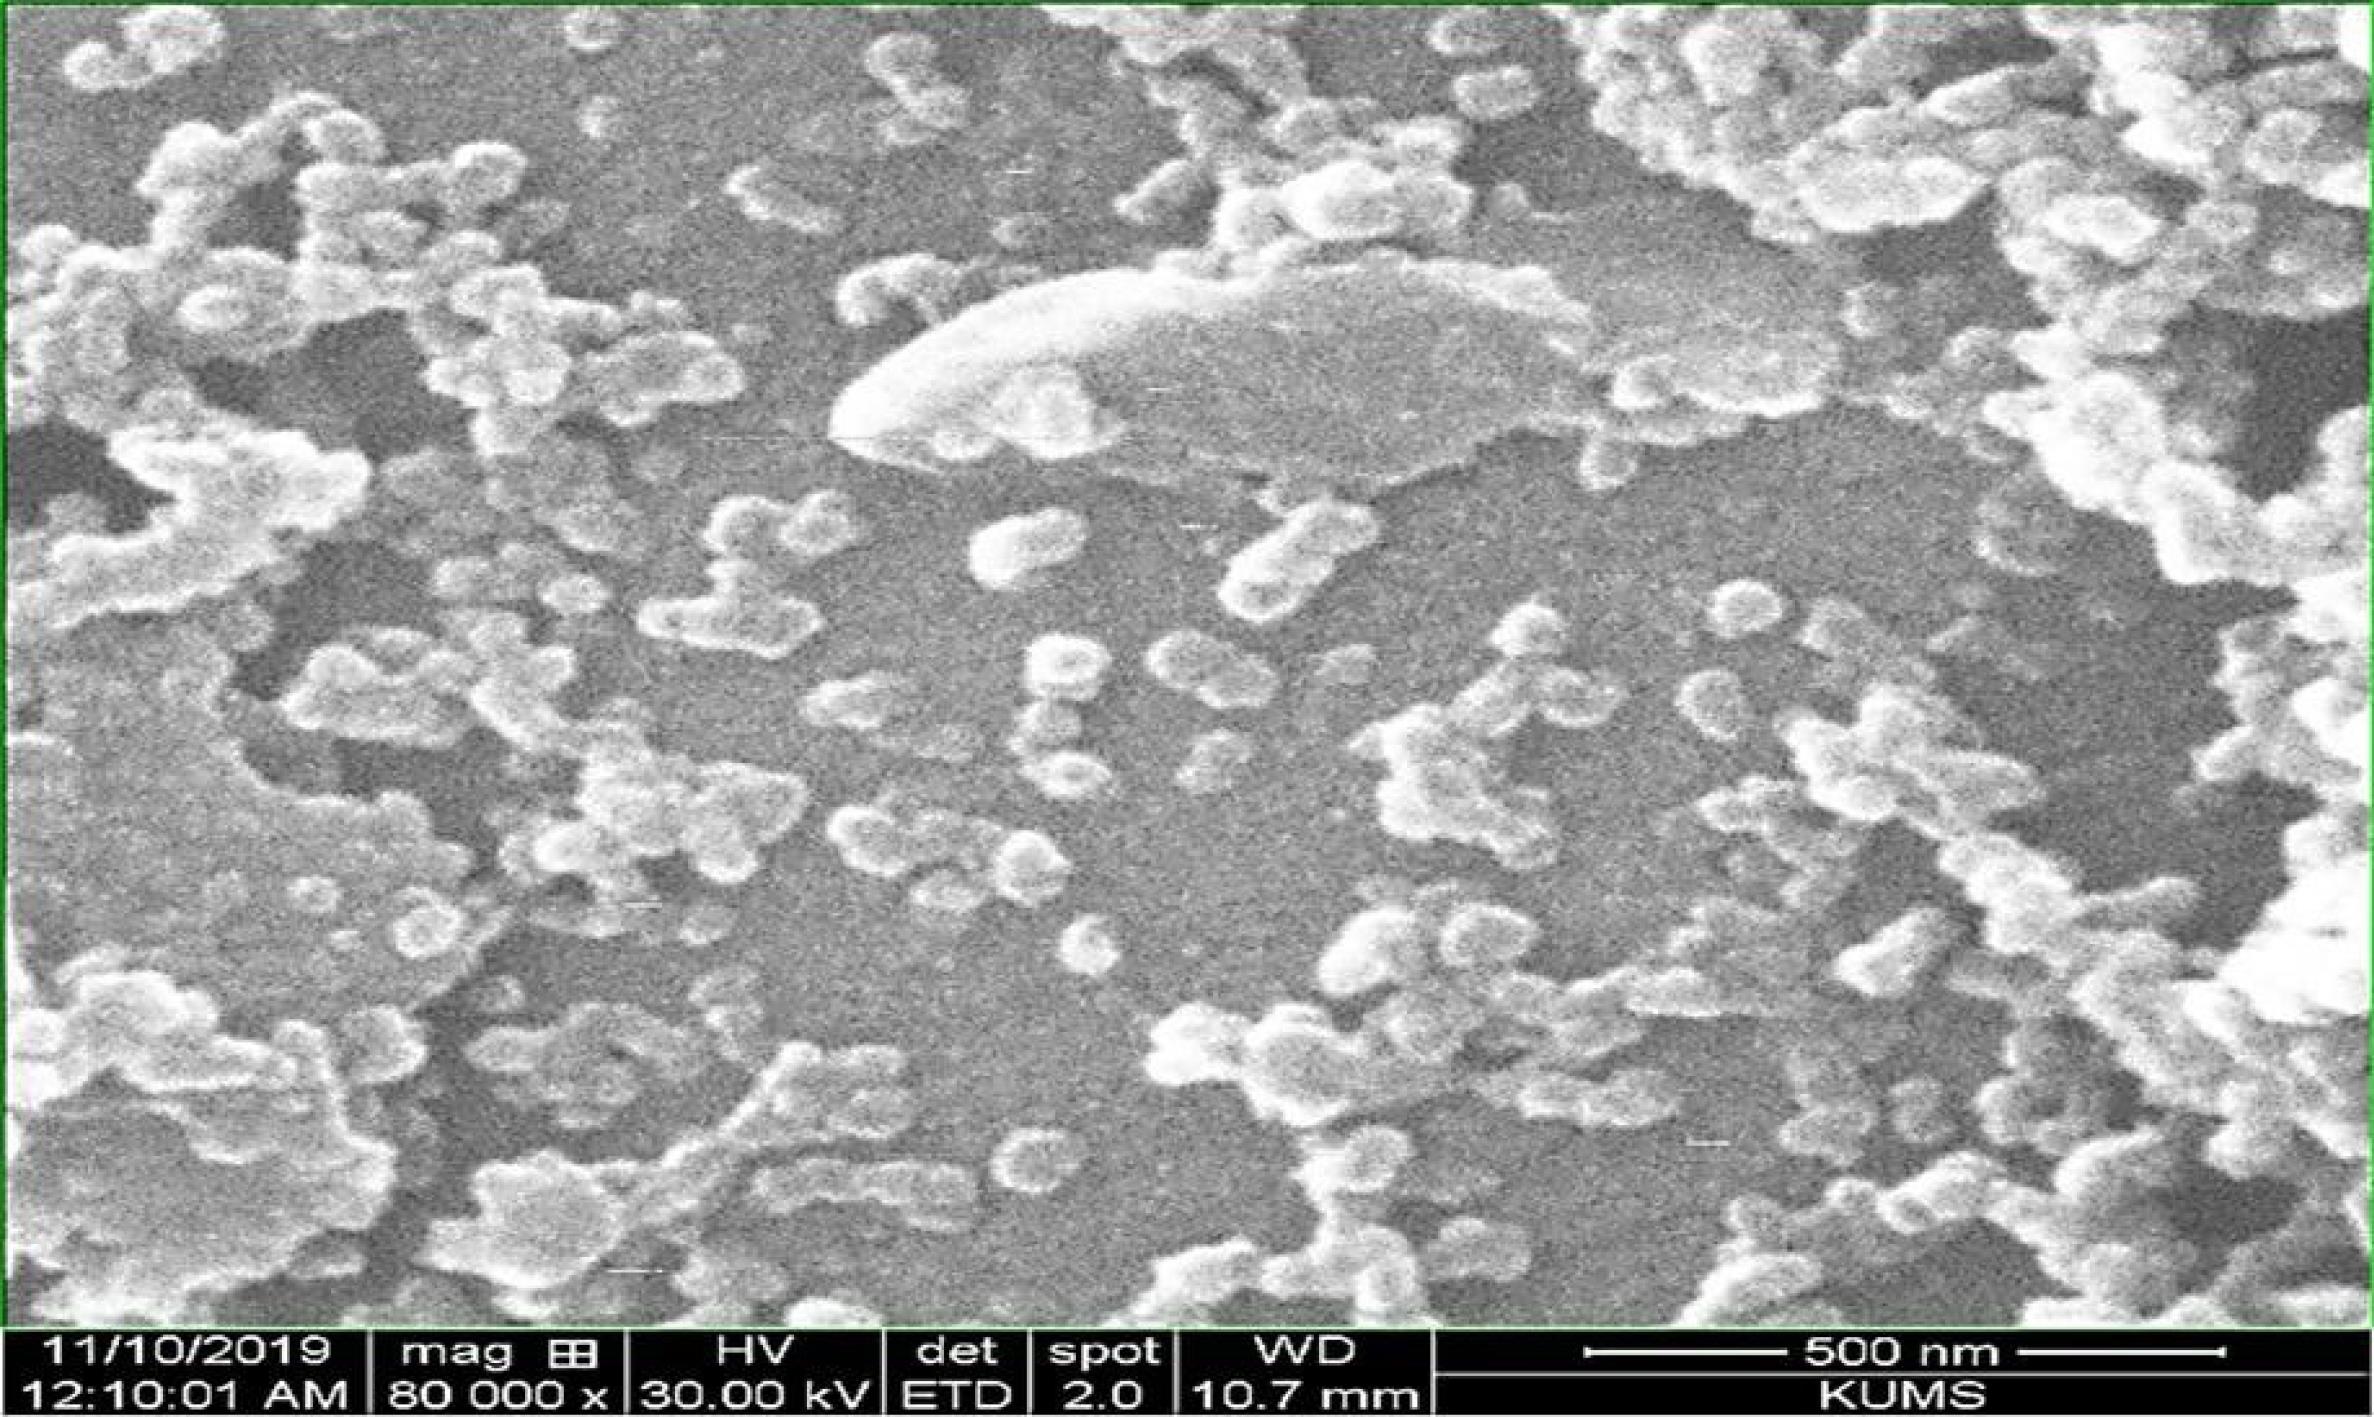
Figure 5.
Scanning electron microscopy Image of Synthesized Silver Nanoparticles
.
Scanning electron microscopy Image of Synthesized Silver Nanoparticles
EDAX was employed to identify the elements and determine the percentage of chemical compounds present in the AgNP structure. In addition to Ag as the major element in the AgNP structure, other elements such as oxygen, carbon, and sulfur were detected in the composition of the molecules covering NPs (Figure 6). In this study, after characterization of the produced AgNPs, their antifungal activity was tested against C. albicans, M. canis, and T. rubrum as three major dermatophyte fungi, showing significant antifungal effects. Using the broth microdilution method, the MIC of synthesized AgNPs was determined for C. albicans, T. rubrum, and M. canis. The absorbance of the samples was read at 630 nm using an ELISA Reader. The average absorbance values of the NPs were calculated based on differences between the initial and final absorbance in the wells, and the absorbance values of the AgNPs for the three fungal species are presented in Table 1.
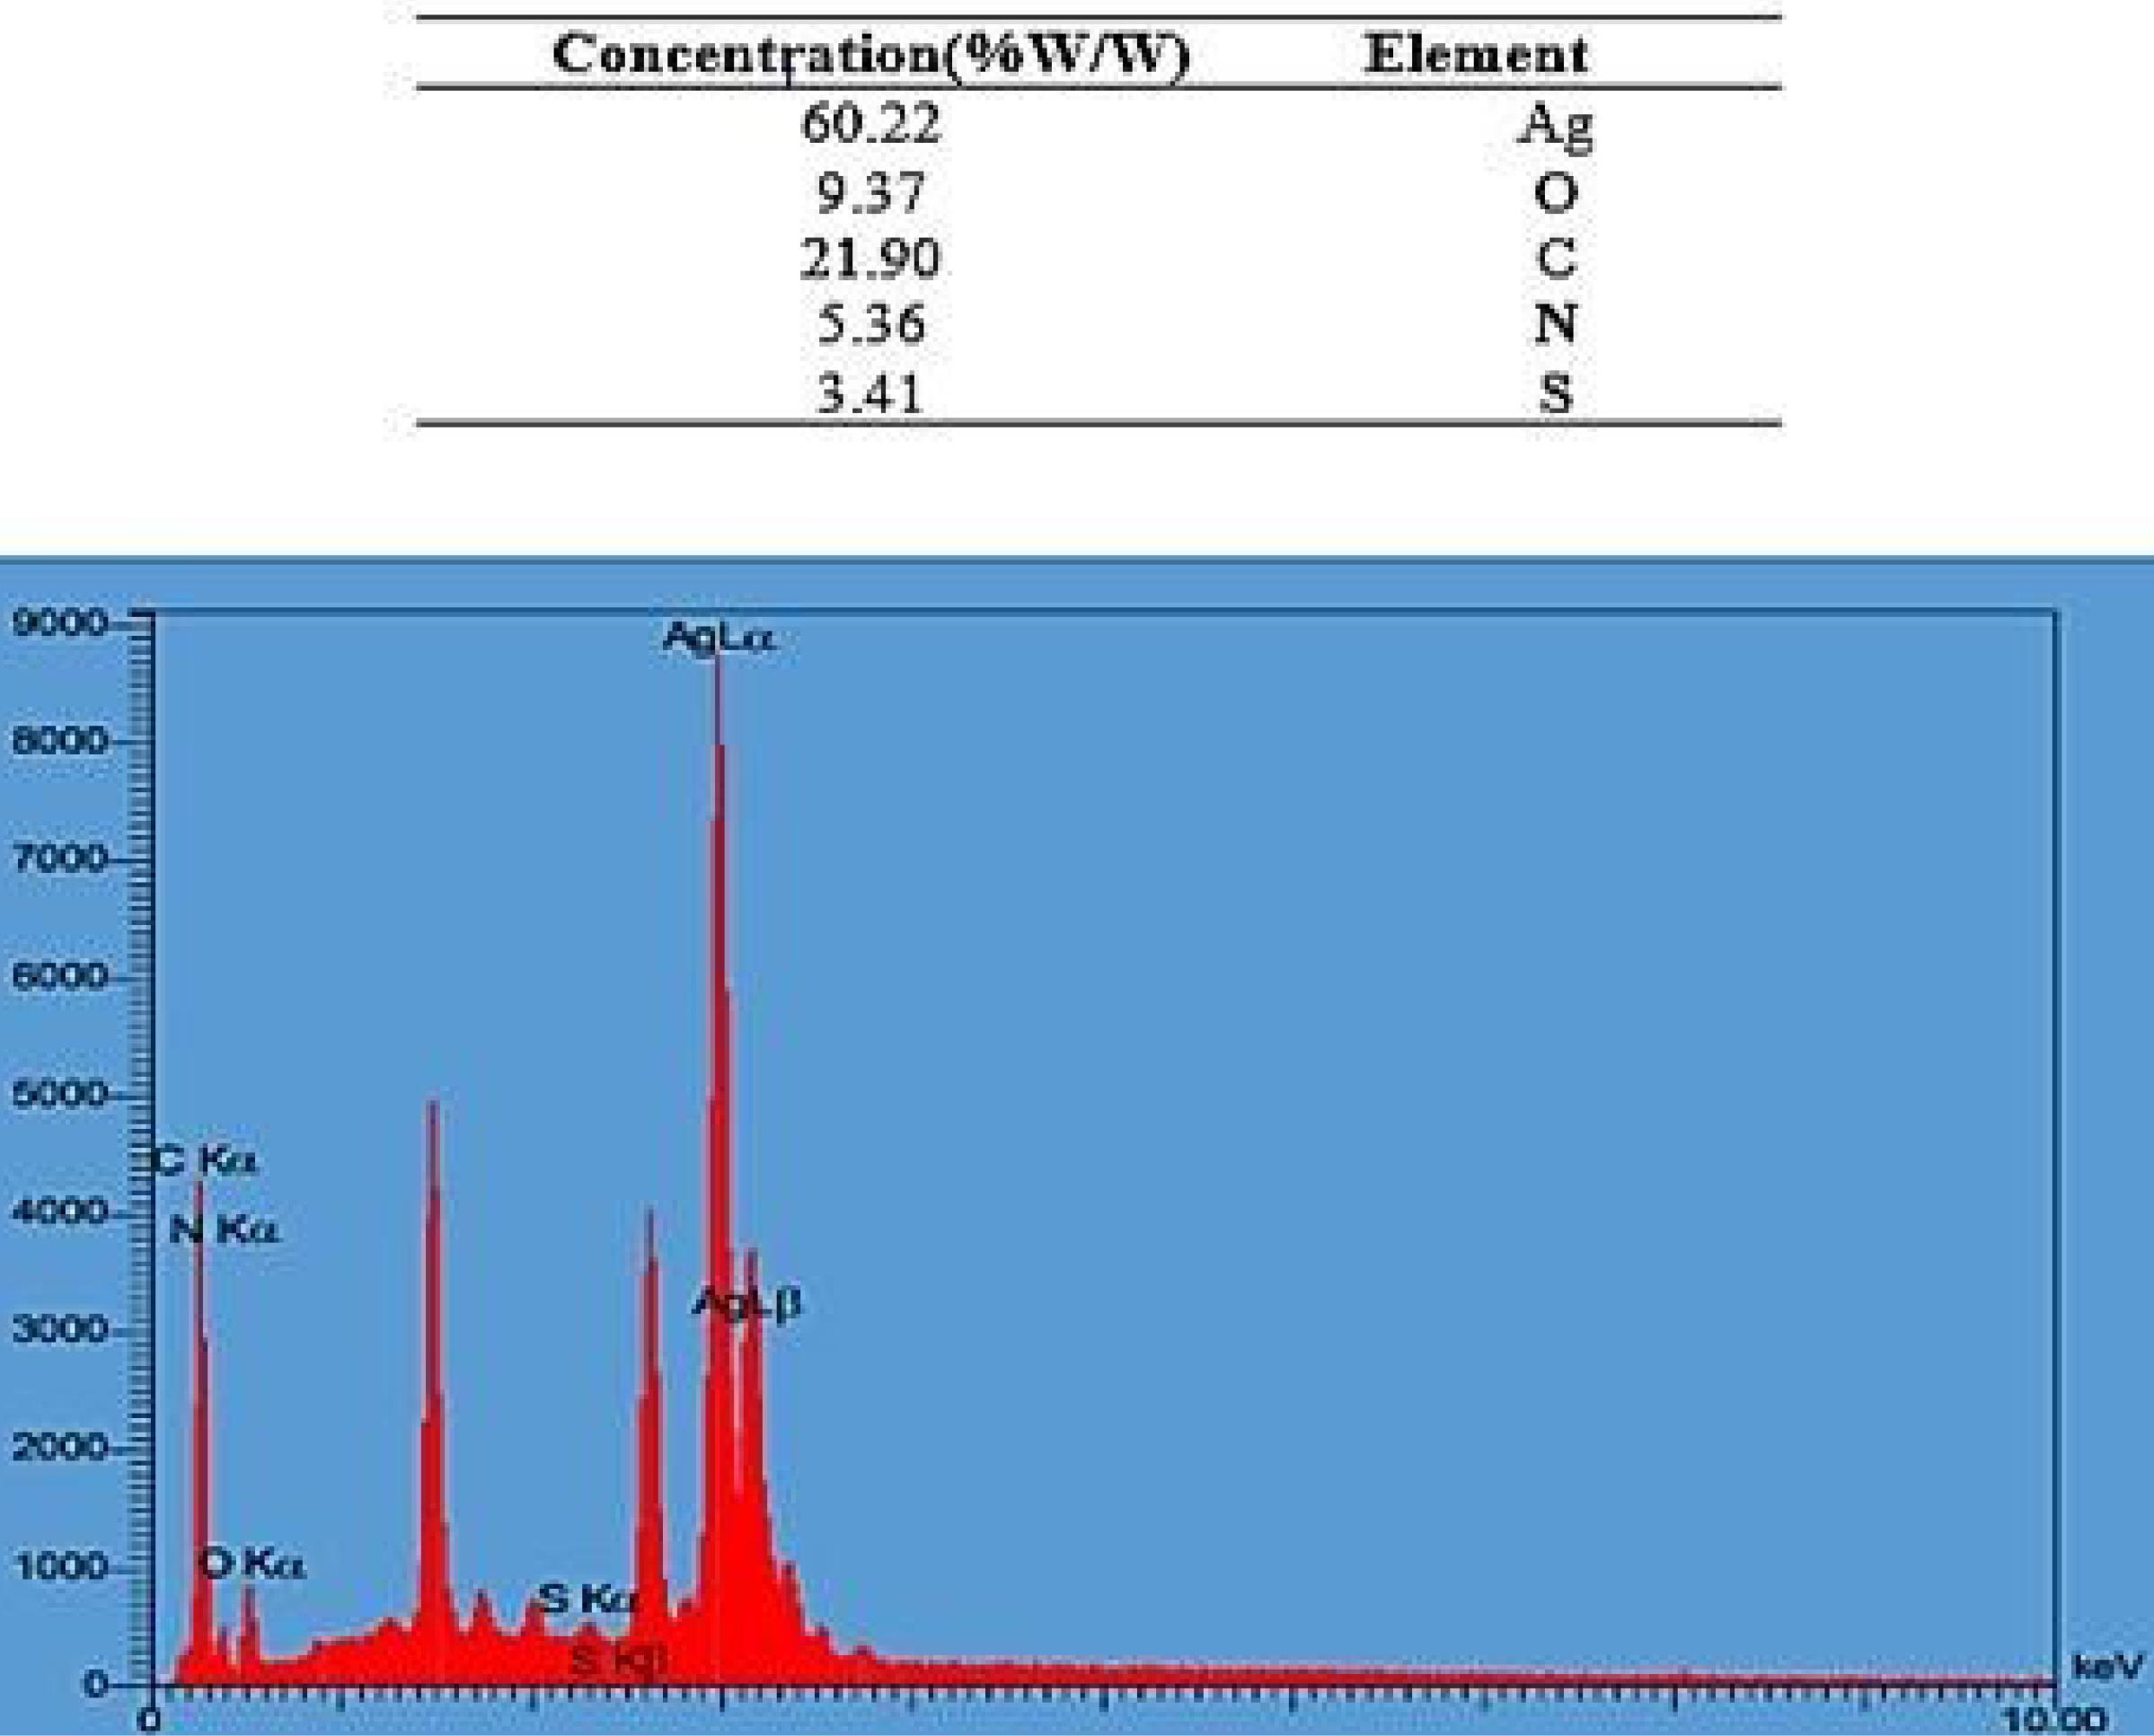
Figure 6.
Energy-Dispersive X-Ray Spectra of Synthesized Silver Nanoparticles
.
Energy-Dispersive X-Ray Spectra of Synthesized Silver Nanoparticles
Table 1.
Ultraviolet Absorption of Different Concentrations of Silver Nanoparticles for Microbial Fungi
|
Concentration (μg/mL)
|
Fungi
|
|
Candida albicans
|
Trichophyton rubrum
|
Microsporum
canis
|
| 0 |
0.1195 ± 0.0007b-h |
0.1595 ± 0.0007b-h |
0.2410 ± 0.0014b-h |
| 7 |
0.0960 ± 0.0014a-h |
0.0610 ± 0.0028a-h |
0.1110 ± 0.0014a-h |
| 15 |
0.0825 ± 0.0035a-h |
-0.0035 ± 0.0021a-h |
0.0840 ± 0.0014a-h |
| 31 |
-0.0085 ± 0.0007a-h |
-0.0110 ± 0.0014a-h |
0.0610 ± 0.0014a-h |
| 62 |
-0.0170 ± 0.0014a-h |
-0.0155 ± 0.0007a-b,d-h |
-0.0040 ± 0.0014a-h |
| 125 |
-0.0295 ± 0.0007a-e,h |
-0.0215 ± 0.0021a-e,h |
-0.0210 ± 0.0014a-h |
| 250 |
-0.0365 ± 0.0021a-e,h |
-0.0265 ± 0.0021a-e,h |
-0.0445 ± 0.0021a-h |
| 500 |
-0.0475 ± 0.0021a-g |
-0.0365 ± 0.0021a-g |
-0.0530 ± 0.0014a-g |
Note. a, b, c, d, e, f, g, and h are values with significant differences. The values are expressed as the mean ± standard deviation. a: Compared to the control group, b: Compared to group 7.8, c: Compared to group 15.7, d: Compared to group 31.25, e: Compared to group 62.5, f: Compared to group 125, g: Compared to group 250, h: Compared to group 500.
Based on the results and conducted analyses, no fungal growth was observed for T. rubrum at concentrations ranging from 500 to 7 ppm, indicating that AgNPs inhibited fungal growth. The lowest concentration was considered the MIC at which no turbidity was observed. A concentration of 7 ppm was confirmed as the MIC for T. rubrum. After determining the MIC, the MIC well (7 µg/mL), along with two wells before and two wells after it, were cultured. No fungal growth was observed at 15.7 µg/mL, which was confirmed as the MFC.
For T. rubrum, an MIC of 7 µg/mL and an MFC of 15 µg/mL were confirmed, indicating that T. rubrum is the most sensitive fungus to the as-prepared AgNPs. Similarly, an MIC of 15 µg/mL and an MFC of 31 µg/mL were confirmed for C. albicans, and an MIC of 31 µg/mL and an MFC of 62 µg/mL were confirmed for M. canis. The results of one-way variance analysis between C. albicans, M. canis, and T. rubrum at different concentrations of AgNPs indicated a significant difference among the groups. At all concentrations, fungal growth was significantly inhibited compared to the control group. The Scheffe post hoc test was utilized to assess which groups differed significantly from the others. A significance level of P ≤ 0.05 was considered for this study (Table 2).
Table 2.
Comparison of the Mean Concentrations of Different Silver Nanoparticles for Microbial Fungi
|
Concentration (μg/mL)
|
Candida albicans
|
Trichophyton rubrum
|
Microsporum
canis
|
F
|
P
|
|
Mean±SD
|
Mean±SD
|
Mean±SD
|
| 0 |
0.119 ± 0.0007b,c |
0.159 ± 0.0007a,c |
0.241 ± 0.0014a,b |
7.668 |
0.0001 |
| 7 |
0.096 ± 0.0014b,c |
0.061 ± 0.0028a,c |
0.111 ± 0.0014a,b |
329.167 |
0.0001 |
| 15 |
0.082 ± 0.0035b |
-0.003 ± 0.0021a,c |
0.084 ± 0.0014b |
792.342 |
0.0001 |
| 31 |
-0.008 ± 0.0007c |
-0.011 ± 0.0014c |
0.061 ± 0.0014b |
2.227 |
0.0001 |
| 62 |
-0.017 ± 0.0014c |
-0.015 ± 0.0007c |
-0.004 ± 0.0014a,b |
67.446 |
0.003 |
| 125 |
-0.029 ± 0.0007b,c |
-0.0215 ± 0.0021a |
-0.0210 ± 0.0014a |
19.500 |
0.019 |
| 250 |
-0.036 ± 0.0021b |
-0.044 ± 0.0021b |
-0.044 ± 0.0021b |
36.48 |
0.008 |
| 500 |
-0.047 ± 0.0021b |
-0.036 ± 0.0021a,c |
-0.052 ± 0.0014b |
38.500 |
0.007 |
Note. a, b, and c are values with significant differences. The values are expressed as mean ± standard deviation (ANOVA: P ≤ 0.05). a: Compared with Candida albicans, b: Compared with Trichophyton rubrum, c: Compared with Microsporum canis.
The results of the inhibitory effect (growth diameter of the fungal disc and growth inhibition rate; Figure 7) of synthesized AgNPs on fungal disk growth showed that the growth rate of fungal mycelium was completely inhibited for all the dermatophytes fungi in this study at a concentration of 500 ppm (Tables 3-5).
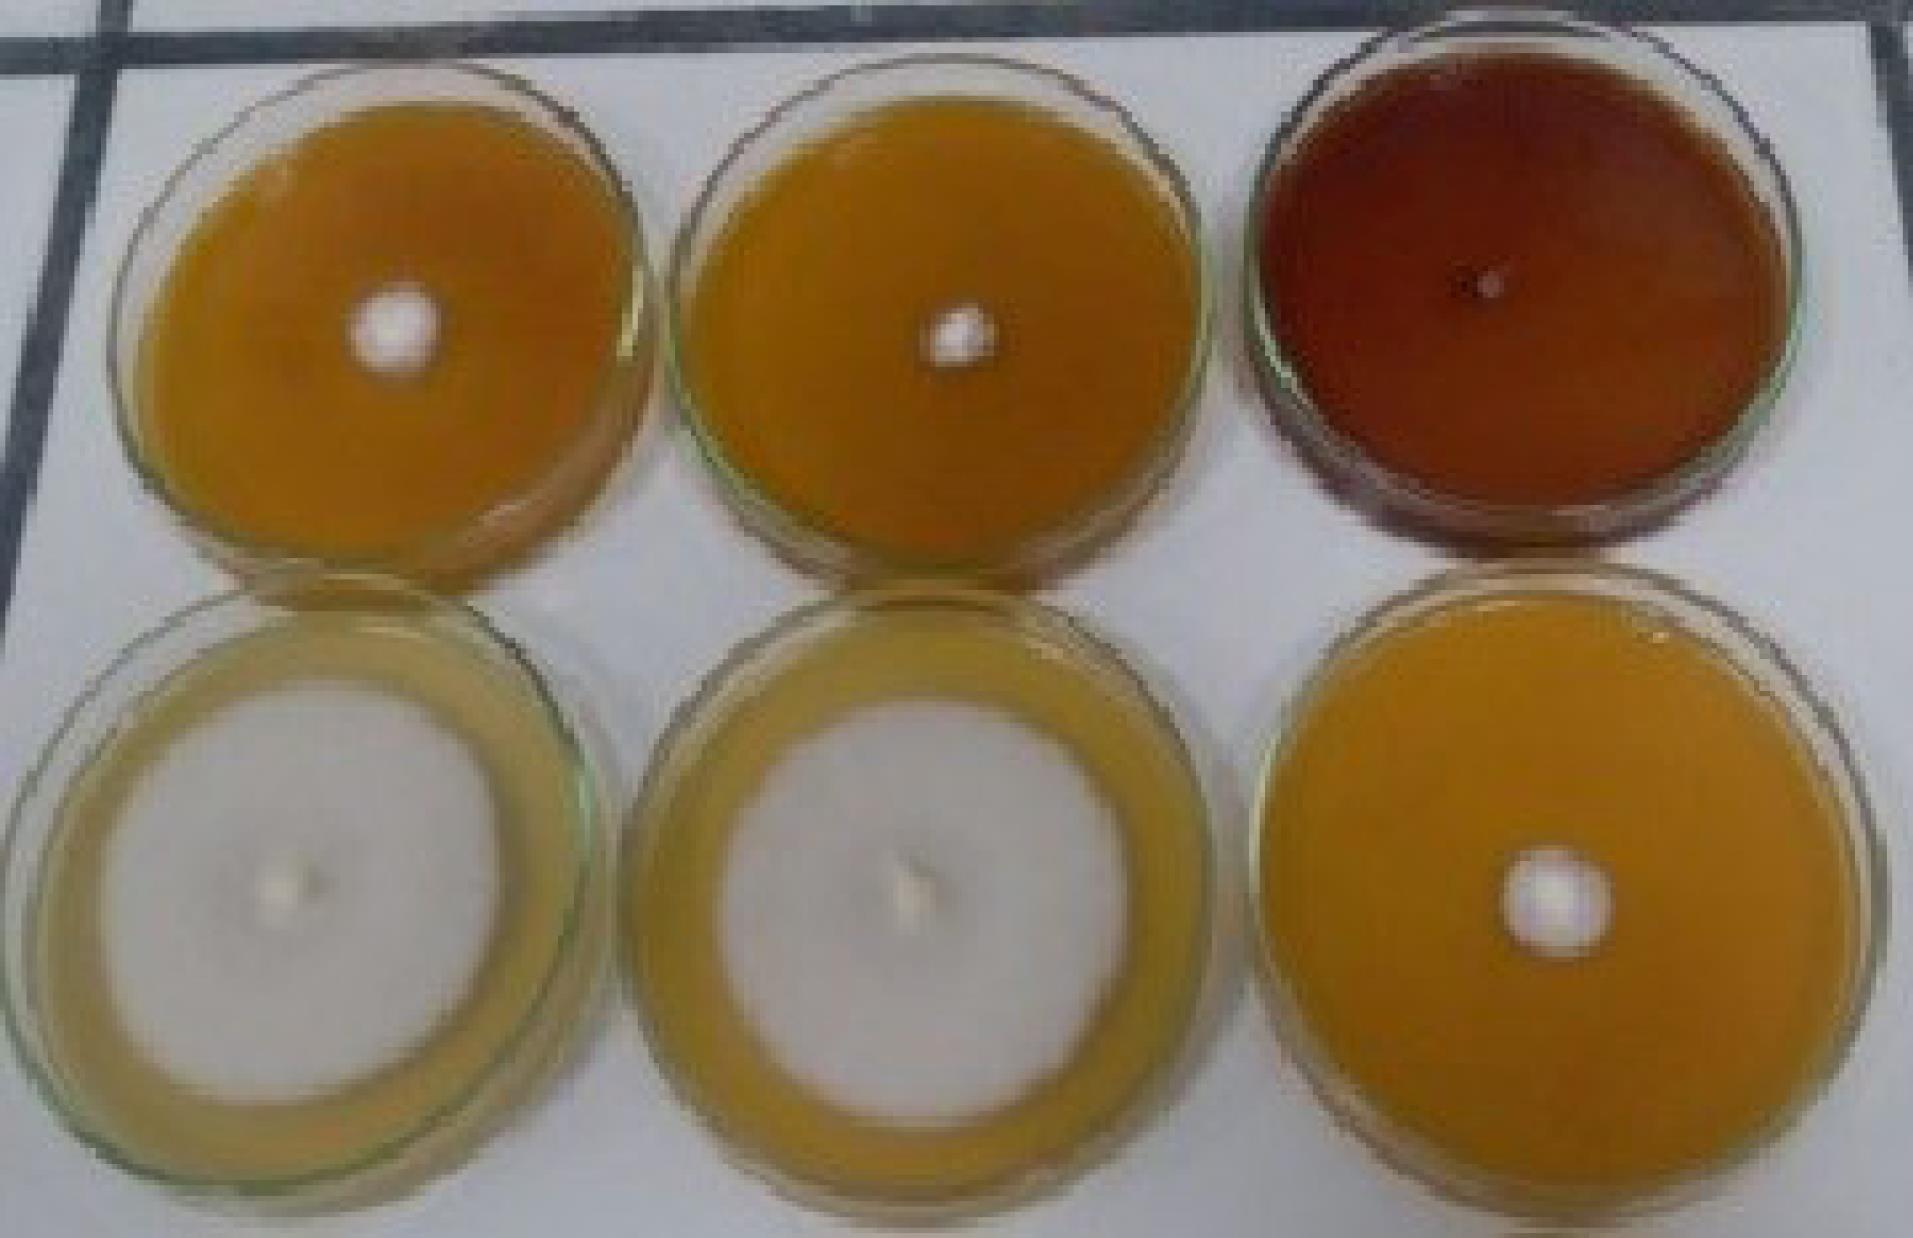
Figure 7.
Inhibition of Fungal Disc Growth Using the Agar Dilution Method
.
Inhibition of Fungal Disc Growth Using the Agar Dilution Method
Table 3.
Inhibiting the Growth of Fungal Discs in Different Concentrations of Silver Nanoparticles
|
Inhibition Growth of Fungal Discs (mm in diameter)
|
|
Concentration (μg/mL)
|
Fungal
|
|
Trichophyton rubrum
|
Candida albicans
|
Microsporum
canis
|
| 0 |
70 ± 0.000b-j |
70 ± 0.000b-j |
70 ± 0.000b-j |
| 7 |
31 ± 1.414a-j |
41.5 ± 0.707a-j |
47.5 ± 0.707a-,j |
| 15 |
20 ± 0.707a-j |
30.5 ± 0.707a-j |
46 ± 0.000a-j |
| 31 |
18.5 ± 0.707a-j |
24.5 ± 0.707a-j |
40 ± 0.707a-j |
| 62 |
13.5 ± 0.707a-j |
15.5 ± 0.707a-j |
37.5 ± 0.707a-j |
| 125 |
8.5 ± 0.707a-j |
14 ± 0.000a-j |
20.5 ± 0.707a-,j |
| 250 |
7 ± 0.000a-j |
9.5 ± 0.707a-j |
14.5 ± 0.707a-j |
| 500 |
0.00 ± 0.000a-j |
0.00 ± 0.000a-j |
0.00 ± 0.000a-j |
| Fluconazole |
0.00 ± 0.000 |
0.00 ± 0.000 |
0.00 ± 0.000 |
| Extract |
59 ± 1.414a-i |
62 ± 2.828a-i |
64 ± 2.828a-i |
Note. a, b, c, d, e, f, g, and h are values with significant differences. The values are expressed as the mean ± standard deviation. a: Compared to the control group, b: Compared to group 7.8, c: Compared to group 15.7, d: Compared to group 31.25, e: Compared to group 62.5, f: Compared to group 125, g: Compared to group 250, h: Compared to group 500, i; Compared to Fluconazole, j: Compared to group Extract.
Table 4.
Comparison of the Mean Inhibition of Fungal Disc Growth at Different Concentrations of Silver Nanoparticles
|
Concentration (μg/mL)
|
Trichophyton rubrum
|
Candida albicans
|
Microsporum
canis
|
F
|
P
|
|
Mean±SD
|
Mean±SD
|
Mean±SD
|
| 0 |
70 ± 0.000 |
70 ± 0.000 |
70 ± 0.000 |
0 |
0 |
| 7 |
31 ± 1.414b,c |
41.5 ± 0.707a,c |
47.5 ± 0.707a,b |
139.500 |
0.001 |
| 15 |
20 ± 0.707b,c |
30.5 ± 0.707a,c |
46 ± 0.000a,b |
990.500 |
0.0001 |
| 31 |
18.5 ± 0.707b,c |
24.5 ± 0.707a,c |
40 ± 0.707a,b |
517.333 |
0.0001 |
| 62 |
13.5 ± 0.707c |
15.5 ± 0.707c |
37.5 ± 0.707a,b |
1.090 |
0.0001 |
| 125 |
8.5 ± 0.707bc |
14 ± 0.000a,c |
14.5 ± 0.707ab |
216.500 |
0.001 |
| 250 |
7 ± 0.000c |
9.5 ± 0.707c |
14.5 ± 0.707ab |
87.500 |
0.002 |
| 500 |
00 ± 0.000 |
00 ± 0.000, |
00 ± 0.000 |
0 |
0 |
Note. a, b, and c are values with significant difference. The values are expressed as mean ± standard deviation (ANOVA: P ≤ 0.05). a: Compared to Candida albicans, b: Compared to Trichophyton rubrum, c: Compared to Microsporum.
Table 5.
Percentage of Inhibition of Fungal Disc Growth in Different Concentrations of Nanoparticles and Extracts
|
Microorganism
|
0
|
500
|
250
|
125
|
62
|
31
|
15
|
7
|
Fluconazole
|
Extract
|
|
Trichophyton rubrum
|
0 |
100% |
90% |
87.7% |
80.7% |
73.5% |
70.71% |
55.71% |
100% |
8.5% |
|
Candida albicans
|
0 |
100% |
86.42% |
80% |
77.85% |
65% |
56.42% |
40.71% |
100% |
11.42% |
|
Microsporum canis
|
0 |
100% |
79.28% |
70.71% |
46.85% |
42.14% |
33.57% |
32.14% |
100% |
15.7% |
Note. The percentage of inhibition of fungal growth was calculated using the following Equation. R: Growth radius of control fungus. r: Sample growth radius.
The lowest level of inhibition of fungal disc growth was observed at a concentration of 7 µg/mL, with a fungal disc growth diameter of 31 mm and an inhibition percentage of 55.71%. This indicates the high sensitivity of T. rubrum to biosynthesized AgNPs, so that even at the lowest concentration, more than half of the fungal growth was inhibited compared to the control. Following T. rubrum, C. albicans, and M. canis were also sensitive to AgNPs. At the lowest concentration of 7 µg/mL, the fungal disc diameters were 41.5 mm and 47.71 mm for C. albicans, M. canis, respectively, with inhibition percentages of 40.71% and 32.14%.
The growth diameter of the fungal disc and the percentage of inhibition by the combined extract of P. harmala and A. sativum were reported as 59 mm and 15.7% for C. albicans, 62 mm and 11.42% for T. rubrum, and 64 mm and 8.5% for M. canis. The inhibitory effect of the combined extract of P. harmala and A. sativum was much lower than that of the synthesized AgNPs, demonstrating the significantly higher antifungal activity of AgNPs compared to the pure plant extracts (Figure 8). The results also revealed that the growth inhibition zone was dependent on the concentration of AgNPs used. The higher the concentration, the greater the growth inhibition zone.
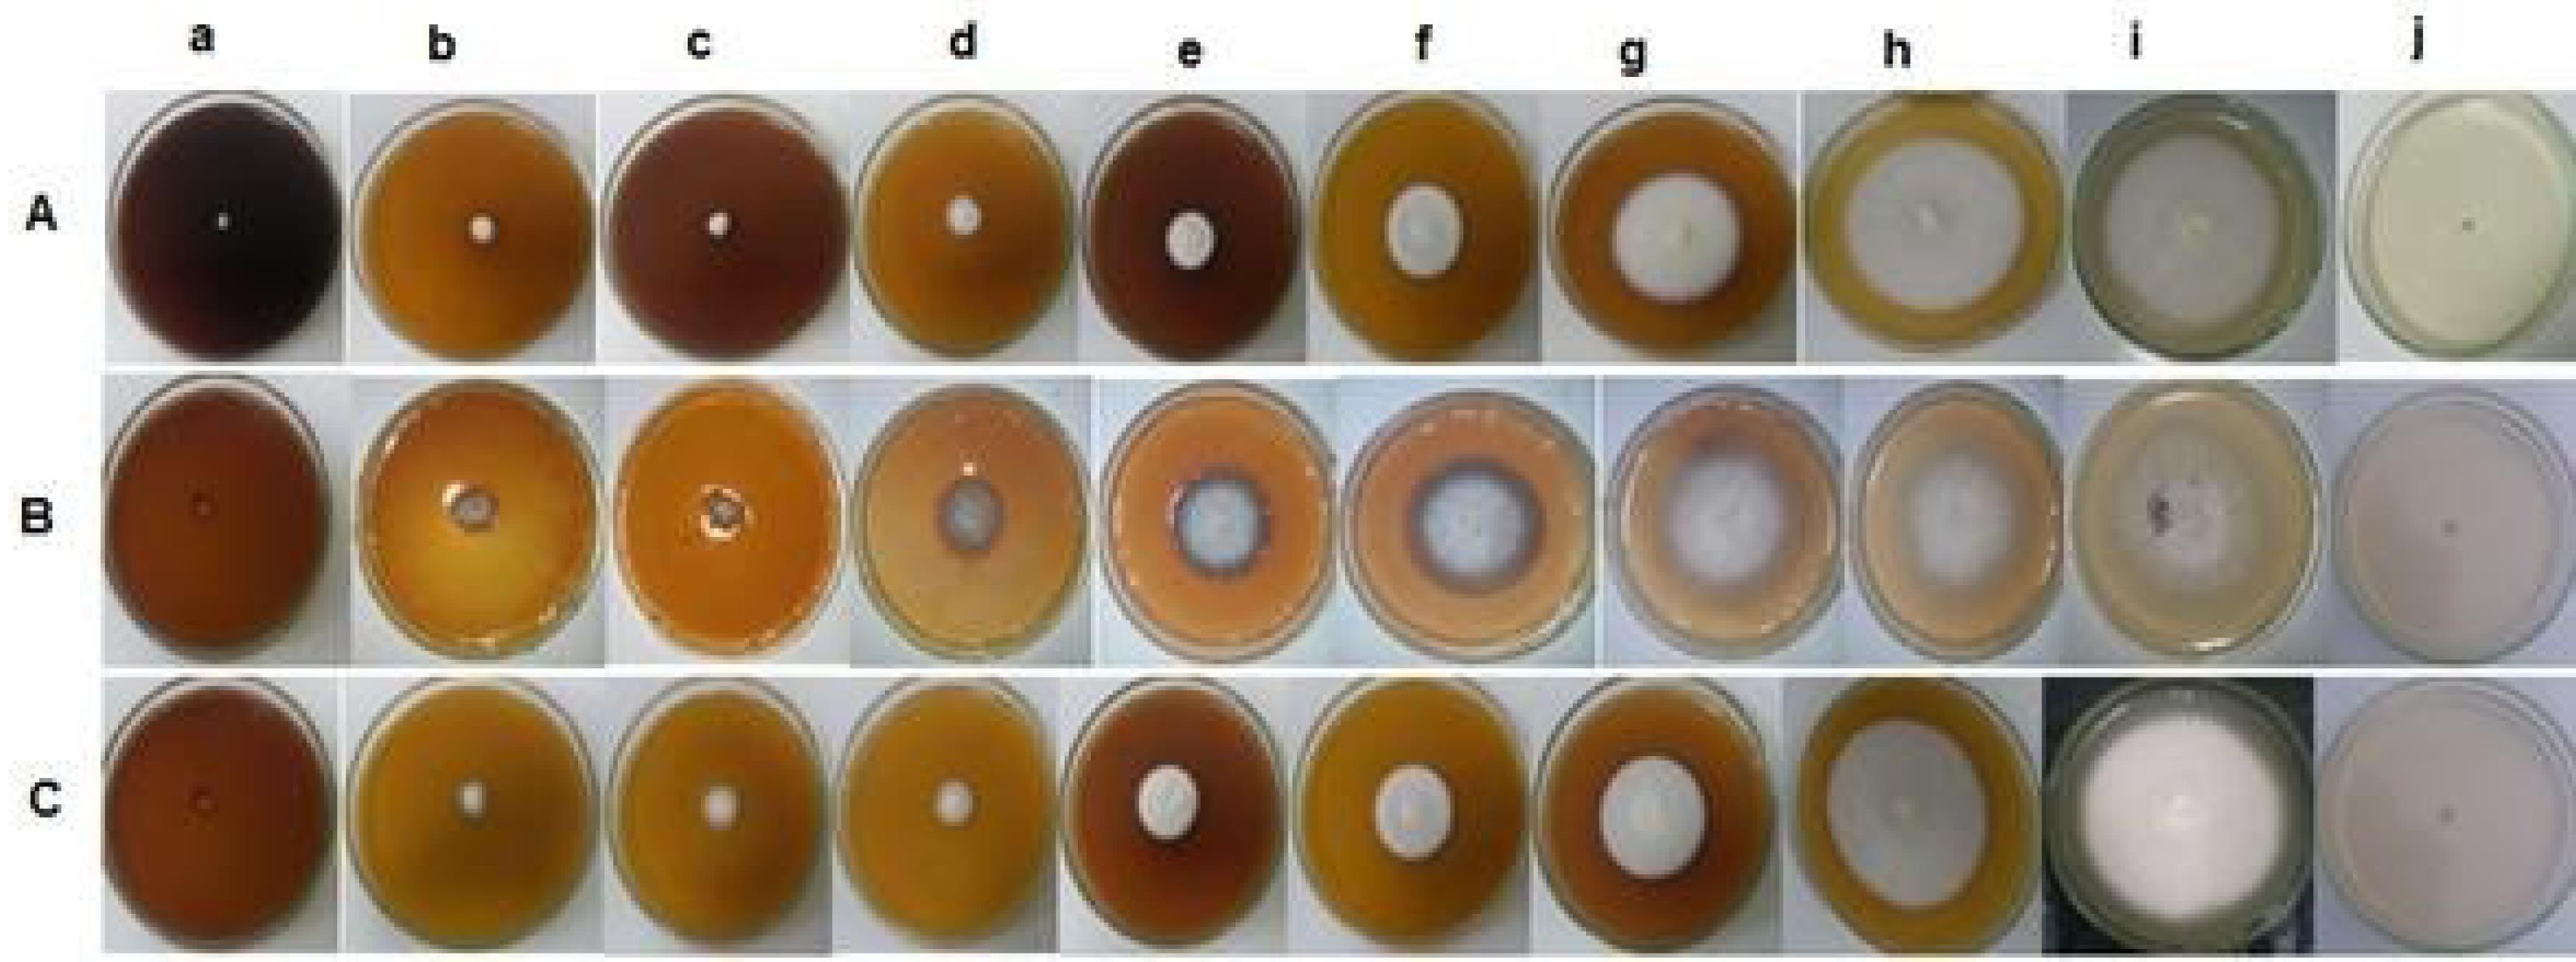
Figure 8.
Fungal Disc Growth Inhibition on PDA medium in the Presence of Different Concentrations of Silver Nanoparticles. Note. A: Trichophyton rubrum, B: Microsporum canis, C: Candida albicans, a (500 ppm), b (250 ppm), c (125 ppm), d (62 ppm), e (31 ppm), f (15 ppm), g (7 ppm), h (Extract), i (control), j (Fluconazole)
.
Fungal Disc Growth Inhibition on PDA medium in the Presence of Different Concentrations of Silver Nanoparticles. Note. A: Trichophyton rubrum, B: Microsporum canis, C: Candida albicans, a (500 ppm), b (250 ppm), c (125 ppm), d (62 ppm), e (31 ppm), f (15 ppm), g (7 ppm), h (Extract), i (control), j (Fluconazole)
Discussion
Plant extracts, due to their antioxidant properties and abundance of secondary metabolites, play a significant role in the reduction and stabilization of NPs (20-22). To date, AgNPs have been biosynthesized using extracts of different plants (23). However, in this study, AgNPs were biosynthesized for the first time using a combined extract of two plants, A. sativum and P. harmala, as well as their antifungal effects were investigated. The results of this study were consistent with previous studies in this field (24-26).
The color change of the solution during the synthesis of AgNPs, from colorless to dark brown, is attributed to the surface plasmon resonance (SPR) phenomenon (13). This color change indicates the formation of NPs and their appropriate size and distribution. The dark brown color typically signifies the stability of the NPs and the lack of aggregation, while other color changes may suggest the formation of larger or unstable structures. After 15 minutes, the lack of further color change indicates that the synthesis process is complete and that the silver ions or reducing agents have been fully consumed. These observations are consistent with earlier studies, supporting the use of color change as a rapid and simple method for evaluating NP quality (12).
The absorption spectrum of AgNPs is within the 400 to 450 nm range, as reported in the literature. The biosynthesized AgNPs in this study exhibited an absorption peak at 450 nm, which is consistent with previous studies (7,13). This uniformity in size is one of the major contributors to the stability of nano systems (7,24). The intensification of surface plasmon resonance in metal NPs depends on the size, shape, and surrounding environment in which the NPs are located (21). Consistent with previous studies, this study observed the SPR of AgNPs in the range of 400 to 450 nm, with an absorption peak observed at 450 nm in the present study (13,27).
The XRD pattern clearly confirmed the formation of AgNPs. XRD analysis revealed distinct peaks at four 2θ values that can be attributed to the 111, 200, 220, and 311 crystal planes of AgNPs. According to this model, the synthesized AgNPs possess a high degree of purity. The absence of additional peaks in the XRD pattern further indicates the high purity and the lack of unwanted phases or non-crystalline structures in the sample. These findings suggest that the synthesis process effectively led to the formation of AgNPs with a uniform and well-defined crystalline structure. Such characteristics can significantly enhance the stability, catalytic activity, and overall performance of the NPs (2).
The surface functional groups of NPs act as both reducers and coatings for NPs (28). The presence of peaks at 3471.74 and 3418.02 cm-1 may indicate the OH functional groups or phenolic compounds. A peak at 1637.43 cm-1 can be related to C = O, while the peak at 1618.89 cm-1 corresponds to NH2 groups. Peaks at 2005 and 1322 cm-1 are associated with alkane C-H or CH3 groups and aromatic compounds. Additionally, a peak at 1095 cm-1 is related to C-O-C bonds, 776 cm-1 is associated with PO, and 620 cm-1 is related to amide N-H. Due to the presence of these groups, some researchers have concluded that alcohols, phenols, carboxylic acids, aliphatic amines, and terpenoid compounds play key roles in the reduction and stabilization processes during the biosynthesis of AgNPs (12,13).
DLS is generally used to assess particle distribution and NP diameter. The results obtained from DLS showed that the diameter of the produced AgNPs was between 70–80 nm. However, SEM revealed that the biosynthesized NPs in this study were mostly spherical with diameters between 40 to 45 nm. The shape and size of the NPs depend on the salt concentration, plant extract, reaction time, and environmental conditions. The results of this study are consistent with previous studies (12,13,29).
Increased drug resistance and the lack of novel antibiotic production are among the most serious threats to human health. Metallic AgNPs have emerged as a promising solution to overcome drug resistance, with numerous studies validating their antimicrobial properties (11). The antifungal effects observed in this study indicated the following order of sensitivity: T. rubrum > C. albicans > M. canis. Specifically, T. rubrum showed the highest sensitivity to synthesized AgNPs, with an MIC of 7 µg/mL and an MFC of 15 µg/mL. Complete inhibition of fungal disc growth was observed at 500 µg/mL, while 55/71% inhibition was noted at 7 µg/mL. Furthermore, C. albicans demonstrated an MIC of 15 µg/mL and MFC of 31 µg/mL, with 100% inhibition at 500 µg/mL and 71.40% at 8 µg/mL. M. canis exhibited the least sensitivity, with an MIC of 31 µg/mL and MFC of 62 µg/mL, resulting in 100% and 32% inhibition at 500 µg/mL and 7 µg/mL, respectively (30,31).
Based on previous studies, M. canis and T. rubrum were the most resistant and sensitive fungi to AgNPs, respectively, which is consistent with our results (12). Robles-Martínez et al studied the antifungal activity of biosynthesized NPs against T. rubrum using A. sativum extract. They reported an MIC of 80 µg/mL, while the MIC was 31 µg/mL in the present study. The stronger antifungal effect of biosynthesized NPs observed in this study can be attributed to the synergistic effects of antifungal compounds in A. sativum and P. harmala extracts (14).
Conclusion
In this study, an environmentally friendly and cost-effective biosynthesis method was utilized to synthesize AgNPs. The results confirm the high potential of A. sativum and P. harmala extracts in reducing silver ions and changing them into AgNPs at the nanometer scale. AgNPs were characterized using DLS, XRD, FTIR, SEM, and EDX. The synthesized AgNPs were spherical, with sizes ranging from 40-45 nm. The antifungal effect of these AgNPs indicates their potential applications in various fields to fight infections, control pollution, and prevent the spread of pathogenic agents.
Acknowledgments
This paper is extracted from the MSc thesis of the first author, submitted to the Department of Biology, Faculty of Science, Razi University, Kermanshah, Iran (Postal Code 67149-67346). The authors acknowledge the personnel of the Laboratory of Microbiology for their technical assistance.
Competing Interests
The authors declare no conflict of interests.
Ethical Approval
Not applicable.
Funding
This study was supported by the intramural fund.
References
- Endo EH, Makimori RY, Companhoni MV, Ueda-Nakamura T, Nakamura CV, Dias Filho BP. Ketoconazole-loaded poly-(lactic acid) nanoparticles: characterization and improvement of antifungal efficacy in vitro against Candida and dermatophytes. J Mycol Med 2020; 30(3):101003. doi: 10.1016/j.mycmed.2020.101003 [Crossref] [ Google Scholar]
- Weitzman I, Summerbell RC. The dermatophytes. Clin Microbiol Rev 1995; 8(2):240-59. doi: 10.1128/cmr.8.2.240 [Crossref] [ Google Scholar]
- Sujatha J, Asokan S, Rajeshkumar S. Antidermatophytic activity of green synthesised zinc oxide nanoparticles using Cassia alata leaves. J Microbiol Biotechnol Food Sci 2018; 7(4):348-52. doi: 10.15414/jmbfs.2018.7.4.348-352 [Crossref] [ Google Scholar]
- Fakhim H, Vaezi A, Dannaoui E, Chowdhary A, Nasiry D, Faeli L. Comparative virulence of Candida auris with Candida haemulonii, Candida glabrata and Candida albicans in a murine model. Mycoses 2018; 61(6):377-82. doi: 10.1111/myc.12754 [Crossref] [ Google Scholar]
- Revie NM, Iyer KR, Robbins N, Cowen LE. Antifungal drug resistance: evolution, mechanisms and impact. Curr Opin Microbiol 2018; 45:70-6. doi: 10.1016/j.mib.2018.02.005 [Crossref] [ Google Scholar]
- Houšť J, Spížek J, Havlíček V. Antifungal drugs. Metabolites 2020; 10(3):106. doi: 10.3390/metabo10030106 [Crossref] [ Google Scholar]
- Rajkumar PV, Prakasam A, Rajeshkumar S, Gomathi M, Anbarasan PM, Chandrasekaran R. Green synthesis of silver nanoparticles using Gymnemasylvestre leaf extract and evaluation of its antibacterial activity. S Afr J Chem Eng 2020; 32(1):1-4. doi: 10.1016/j.sajce.2019.11.005 [Crossref] [ Google Scholar]
- Hirpara DG, Gajera HP. Green synthesis and antifungal mechanism of silver nanoparticles derived from chitin‐induced exometabolites of Trichoderma interfusant. Appl Organomet Chem 2020; 34(3):e5407. doi: 10.1002/aoc.5407 [Crossref] [ Google Scholar]
- Das P, Barua S, Sarkar S, Karak N, Bhattacharyya P, Raza N. Plant extract-mediated green silver nanoparticles: efficacy as soil conditioner and plant growth promoter. J Hazard Mater 2018; 346:62-72. doi: 10.1016/j.jhazmat.2017.12.020 [Crossref] [ Google Scholar]
- Vijay Kumar PPN, Pammi SV, Kollu P, Satyanarayana KV, Shameem U. Green synthesis and characterization of silver nanoparticles using Boerhaaviadiffusa plant extract and their anti-bacterial activity. Ind Crops Prod 2014; 52:562-6. doi: 10.1016/j.indcrop.2013.10.050 [Crossref] [ Google Scholar]
- Kumar M, Curtis A, Hoskins C. Application of nanoparticle technologies in the combat against anti-microbial resistance. Pharmaceutics 2018; 10(1):11. doi: 10.3390/pharmaceutics10010011 [Crossref] [ Google Scholar]
- Saravanakumar K, Chelliah R, Shanmugam S, Varukattu NB, Oh DH, Kathiresan K. Green synthesis and characterization of biologically active nanosilver from seed extract of Gardenia jasminoides Ellis. J Photochem Photobiol B 2018; 185:126-35. doi: 10.1016/j.jphotobiol.2018.05.032 [Crossref] [ Google Scholar]
- Behravan M, Hossein Panahi A, Naghizadeh A, Ziaee M, Mahdavi R, Mirzapour A. Facile green synthesis of silver nanoparticles using Berberis vulgaris leaf and root aqueous extract and its antibacterial activity. Int J Biol Macromol 2019; 124:148-54. doi: 10.1016/j.ijbiomac.2018.11.101 [Crossref] [ Google Scholar]
- Robles-Martínez M, González JFC, Pérez-Vázquez FJ, Montejano-Carrizales JM, Pérez E, Patiño-Herrera R. Antimycotic activity potentiation of Allium sativum extract and silver nanoparticles against Trichophyton rubrum. Chem Biodivers 2019; 16(4):e1800525. doi: 10.1002/cbdv.201800525 [Crossref] [ Google Scholar]
- Fazlzadeh M, Khosravi R, Zarei A. Green synthesis of zinc oxide nanoparticles using Peganum harmala seed extract, and loaded on Peganum harmala seed powdered activated carbon as new adsorbent for removal of Cr(VI) from aqueous solution. Ecol Eng 2017; 103(Pt A):180-90. doi: 10.1016/j.ecoleng.2017.02.052 [Crossref] [ Google Scholar]
- Zia M, Mannani R, Mahmoodi M, Bayat M, Mohaghegh F. The effects of alcoholic extract of propolis obtained from Iran bee hives on the growth of Trichophyton mentagrophytes, Trichophyton rubrum and Trichophyton verrucosum. J Isfahan Med Sch 2009;27(95):232-41. [Persian].
- Pfaller MA, Chaturvedi V, Espinel-Ingroff A, Ghannooum M, Gosey L, Odds FC. Reference Method for Broth Dilution Antifungal Susceptibility Testing of Filamentous Fungi: Approved Standard. NCCLS Document M38-A. Wayne, PA: CLSI; 2002.
- Clinical and Laboratory Standards Institute (CLSI). Reference Method for Broth Dilution Antifungal Susceptibility Testing of Yeasts; Approved Standard. CLSI Document M27-A2. Wayne, PA: CLSI; 2002.
- Tyagi PK, Mishra R, Khan F, Gupta D, Gola D. Antifungal effects of silver nanoparticles against various plant pathogenic fungi and its safety evaluation on Drosophila melanogaster. Biointerface Res Appl Chem 2020; 10(6):6587-96. doi: 10.33263/briac106.65876596 [Crossref] [ Google Scholar]
- Mahmoudi P, Amini K, Amini P. Molecular study of Candida albicans isolated from periodontal infections and effect of Sargassum alga extract on biofilm ALS gene expression using real-time-PCR. J Dent Med 2019;32(1):11-21. [Persian].
- Ahmed S, Ahmad M, Swami BL, Ikram S. A review on plants extract mediated synthesis of silver nanoparticles for antimicrobial applications: a green expertise. J Adv Res 2016; 7(1):17-28. doi: 10.1016/j.jare.2015.02.007 [Crossref] [ Google Scholar]
- Yu C, Tang J, Liu X, Ren X, Zhen M, Wang L. Green biosynthesis of silver nanoparticles using Eriobotrya japonica (Thunb) leaf extract for reductive catalysis. Materials (Basel) 2019; 12(1):189. doi: 10.3390/ma12010189 [Crossref] [ Google Scholar]
- Sharma G, Kumar D, Kumar A, Al-Muhtaseb AH, Pathania D, Naushad M. Revolution from monometallic to trimetallic nanoparticle composites, various synthesis methods and their applications: a review. Mater Sci Eng C Mater Biol Appl 2017; 71:1216-30. doi: 10.1016/j.msec.2016.11.002 [Crossref] [ Google Scholar]
- Amendola V, Bakr OM, Stellacci F. A study of the surface plasmon resonance of silver nanoparticles by the discrete dipole approximation method: effect of shape, size, structure, and assembly. Plasmonics 2010; 5(1):85-97. doi: 10.1007/s11468-009-9120-4 [Crossref] [ Google Scholar]
- Verma A, Mehata MS. Controllable synthesis of silver nanoparticles using Neem leaves and their antimicrobial activity. J Radiat Res Appl Sci 2016; 9(1):109-15. doi: 10.1016/j.jrras.2015.11.001 [Crossref] [ Google Scholar]
- Moteriya P, Chanda S. Green synthesis of silver nanoparticles from Caesalpinia pulcherrima Leaf extract and evaluation of their antimicrobial, cytotoxic and genotoxic potential (3-in-1 system). J Inorg Organomet Polym Mater 2020; 30(10):3920-32. doi: 10.1007/s10904-020-01532-7 [Crossref] [ Google Scholar]
- Pirtarighat S, Ghannadnia M, Baghshahi S. Green synthesis of silver nanoparticles using the plant extract of Salvia spinosa grown in vitro and their antibacterial activity assessment. J Nanostruct Chem 2019; 9(1):1-9. doi: 10.1007/s40097-018-0291-4 [Crossref] [ Google Scholar]
- Elmusa F, Aygun A, Gulbagca F, Seyrankaya A, Göl F, Yenikaya C. Investigation of the antibacterial properties of silver nanoparticles synthesized using Abelmoschus esculentus extract and their ceramic applications. Int J Environ Sci Technol 2021; 18(4):849-60. doi: 10.1007/s13762-020-02883-x [Crossref] [ Google Scholar]
- Davarnia B, Shahidi SA, Karimi-Maleh H, Ghorbani-Hasansaraei A, Karimi F. Biosynthesis of Ag nanoparticle by Peganum harmala extract; antimicrobial activity and ability for fabrication of quercetin food electrochemical sensor. Int J Electrochem Sci 2020; 15(3):2549-60. doi: 10.20964/2020.03.70 [Crossref] [ Google Scholar]
- Zhang W, Yao Y, Sullivan N, Chen Y. Modeling the primary size effects of citrate-coated silver nanoparticles on their ion release kinetics. Environ Sci Technol 2011; 45(10):4422-8. doi: 10.1021/es104205a [Crossref] [ Google Scholar]
- Jalal M, Ansari MA, Alzohairy MA, Ali SG, Khan HM, Almatroudi A. Biosynthesis of silver nanoparticles from oropharyngeal Candida glabrata isolates and their antimicrobial activity against clinical strains of bacteria and fungi. Nanomaterials (Basel) 2018; 8(8):586. doi: 10.3390/nano8080586 [Crossref] [ Google Scholar]