Avicenna Journal of Clinical Microbiology and Infection. 11(2):87-96.
doi: 10.34172/ajcmi.3524
Original Article
Molecular Surveillance of Artemisinin Combination Therapy Resistance Markers in Kelch13 Gene of Plasmodium falciparum Isolates Collected From Yobe State Nigeria
Abdulhamid Abubakar Zubair 1, *  , Gabriel Adegboyega Ajibade 2 , Ali Ahmed Haroun 3, Karderam Bukar Dikwa 2 , Sagir Adamu Barde 1 , Simdung Wuriba Kopdorah 1 , Amina Yusuf Bulama 1 , Umar Faruk Abubakar 4 , Muttaka Auwalu 5 , Muhammad Ribado Bashir 6
Author information:
1Department of Biochemistry, Faculty of Science, Federal University Gashua, Yobe State, Nigeria
2Department of Biological Sciences, Faculty of Science, Nigerian Defence Academy, Kaduna State, Nigeria
3Department of Biotechnology, Faculty of Science, Nigerian Defence Academy, Kaduna State, Nigeria
4Health Services, Laboratory Department, Yusuf Maitama Sule University Kano, Nigeria
5Department of Biochemistry, Faculty of Science, Federal University Gusau, Zamfara State, Nigeria
6Department of Biological Sciences, Faculty of Science, Federal University Gusau, Zamfara State, Nigeria
Abstract
Background: Despite the discovery of artemisinin and artemisinin combination therapies (ACTs), resistance emerged due to single-nucleotide polymorphisms (SNPs) at the Kelch13 propeller domain of Plasmodium falciparum; the predominant parasite causing malaria. This research aimed at surveying the gene responsible for reduced parasite clearance of the first-line antimalarial ACT in Yobe State, Nigeria.
Methods: This study analyzed the blood samples of 300 patients (18-50 years) from 3 different hospitals in Yobe State for malaria using a rapid diagnostic test (malarial strip test). The Giemsa microscopy protocol was performed on the samples that tested positive in order to increase specificity for high parasitemia. Positive samples from microscopy were confirmed by COXIII gene polymerase chain reaction amplification. The fragments of the P. falciparum kelch13 gene encompassing the propeller domains were amplified and sequenced to detect polymorphism.
Results: The result of multiple sequence alignment of 16 successfully sequenced samples performed alongside the reference 3D7 strain revealed nine novel mutations that have not been reported elsewhere. Two were synonymous (S485S and A675A), and seven were non-synonymous (E461V, S485R, D648H, E668Q, S679L, H697Y, and W706M). The genetic diversity parameters obtained in this study indicated non-severe mutations with haplotype diversity [Hd=0.662, D (Tadjima)=-2.16692 and D* (Fu and Li) -3.08435]. Seven different haplotypes were discovered, and the result of the haplotype network demonstrated Hap_1 to be the predominant haplotype in the population.
Conclusion: The absence of the WHO-validated markers may suggest that ACTs are still effective in Yobe.
Keywords: Artemisinins, Single-nucleotide polymorphism, Resistance, Plasmodium falciparum, PfKelch13
Copyright and License Information
© 2024 The Author(s); Published by Hamadan University of Medical Sciences.
This is an open-access article distributed under the terms of the Creative Commons Attribution License (
https://creativecommons.org/licenses/by/4.0), which permits unrestricted use, distribution, and reproduction in any medium, provided the original work is properly cited.
Please cite this article as follows: Zubair AA, Ajibade GA, Haroun AA, Dikwa KB, Barde SA, Kopdorah SW, et al. Molecular surveillance of artemisinin combination therapy resistance markers in Kelch13 gene of Plasmodium falciparum isolates collected From Yobe State Nigeria. Avicenna J Clin Microbiol Infect. 2024; 11(2):87-96. doi:10.34172/ajcmi.3524
Introduction
For millennia, malaria has been one of the infectious diseases that has received the most attention (1,2). Every year, malaria claims the lives of over 405 000 individuals, 93% of whom are in Africa, with Nigeria accounting for 25% of these deaths. The complicated biology of the parasites, polymorphism, and their rising resistance to antimalarial medications, particularly in endemic locations, are only a few variables that have made it difficult to effectively treat this illness (3). Plans to eradicate malaria as a serious illness are impeded by the absence of a viable vaccine and extensive antimalarial medication resistance (4).
Many affected nations adopted the World Health Organization’s (WHO’s) recommendation of artemisinin combination therapy (ACT) as a first-line treatment of malaria starting in 2005 (5,6). The decrease in malaria cases and deaths worldwide has been largely attributed to the widespread use of ACTs, which combine an artemisinin derivative with a different medication (7). According to a WHO report from 2021, the use of ACTs increased 30 times worldwide between 2006 and 2013. Therefore, it is anticipated that the rising intake of artemisinin agents will exacerbate drug pressure and result in the emergence of resistance (8,9). Sadly, delays in parasite clearance have been reported in other areas of the country due to alterations in the Kelch13 gene (10).
Right now, ACT cannot be completely replaced by any totally effective first-line therapy in the event that artemisinin fails everywhere. The advancements gained in the fight against malaria are in jeopardy due to the global expansion of ACT resistance. Hence, molecular indicators of resistance have become useful epidemiologic tools for studying antimalarial drug resistance (11).
According to the WHO, 9 single-nucleotide polymorphisms (SNPs) in the PfKelch13 gene have been confirmed as molecular markers for artemisinin resistance at this time (F446I, N458Y, M476I, Y493H, R539T, I543T, P553L, R561H, and C580Y). However, little information has been available up to this point about population frequency changes associated with these mutations and the nature of their spread within the same endemic area (12,13). Various mutations have already been discovered across the continents of Asia, America, and Africa, with a greater incidence found on the Asian continent (14).
Non-synonymous (NS) SNPs are sparingly found in Africa, particularly in Ethiopia, Kenya, Rwanda, Senegal, Mali, and the like; however, P570L, Y558C, M472I, K563R, and P615S are few novel NS mutations observed in the Niger Republic, in addition to A578S, which was reported in other surveys conducted in Africa (6,15).
In Kenya, mutations have been reported at codons R561H, R539T, N458Y, N431S, and A671V, P574L, C580Y, and A675V, but only in rare instances (8). Mutations A569S and A578S were previously described in Uganda, Kenya; the latter is frequently documented (16). In Ghana, C580V and C580R were respectively reported at the same locus with the major Asian marker, C580Y (9). C469C and A578S are the most common mutations associated with Africa. A recent study in Nigeria has reported A578S, F442L, N664N, P443A, and Q613N mutations (17).
In this study, by the molecular surveillance of the Kelch13 gene, it has been attempted to explain delayed parasite clearance associated with ACT drugs in patients suffering from malaria in Yobe State, Nigeria. This was performed by the surveillance of the propeller domain of the pfkelch13 gene to detect the presence of the existing WHO-validated genetic markers or otherwise.
Materials and Methods
Study Area
Yobe State has a total land area of 47,153 square kilometers and is situated between latitude 110 North and longitude 13.50 East (Figure 1). Its borders are shared by Bauchi and Gombe States to the southwest, Jigawa State to the northwest, and Borno State to the east and southeast. The wet season is associated with the moist maritime southerly air mass that originates from the Atlantic Ocean. Additionally, it borders the Republic of Niger on the outside. This border extends 323 km north of the state. With a few scattered acacia trees, the state’s vegetation is primarily of the Sudan Savannah variety. Additionally, in the far north, there is a region of the Sahel Savannah with sandy soils. The moist maritime southerly air mass, which is a product of the Atlantic Ocean, is linked to the wet season. The region has consistent weather, with August being the wettest month, though there has been a recent movement to July. The usual start and end dates of the region’s 450 mm annual precipitation are June and September, respectively. The samples were taken in July, at the height of the malaria season, when rainfall was at its heaviest (18).
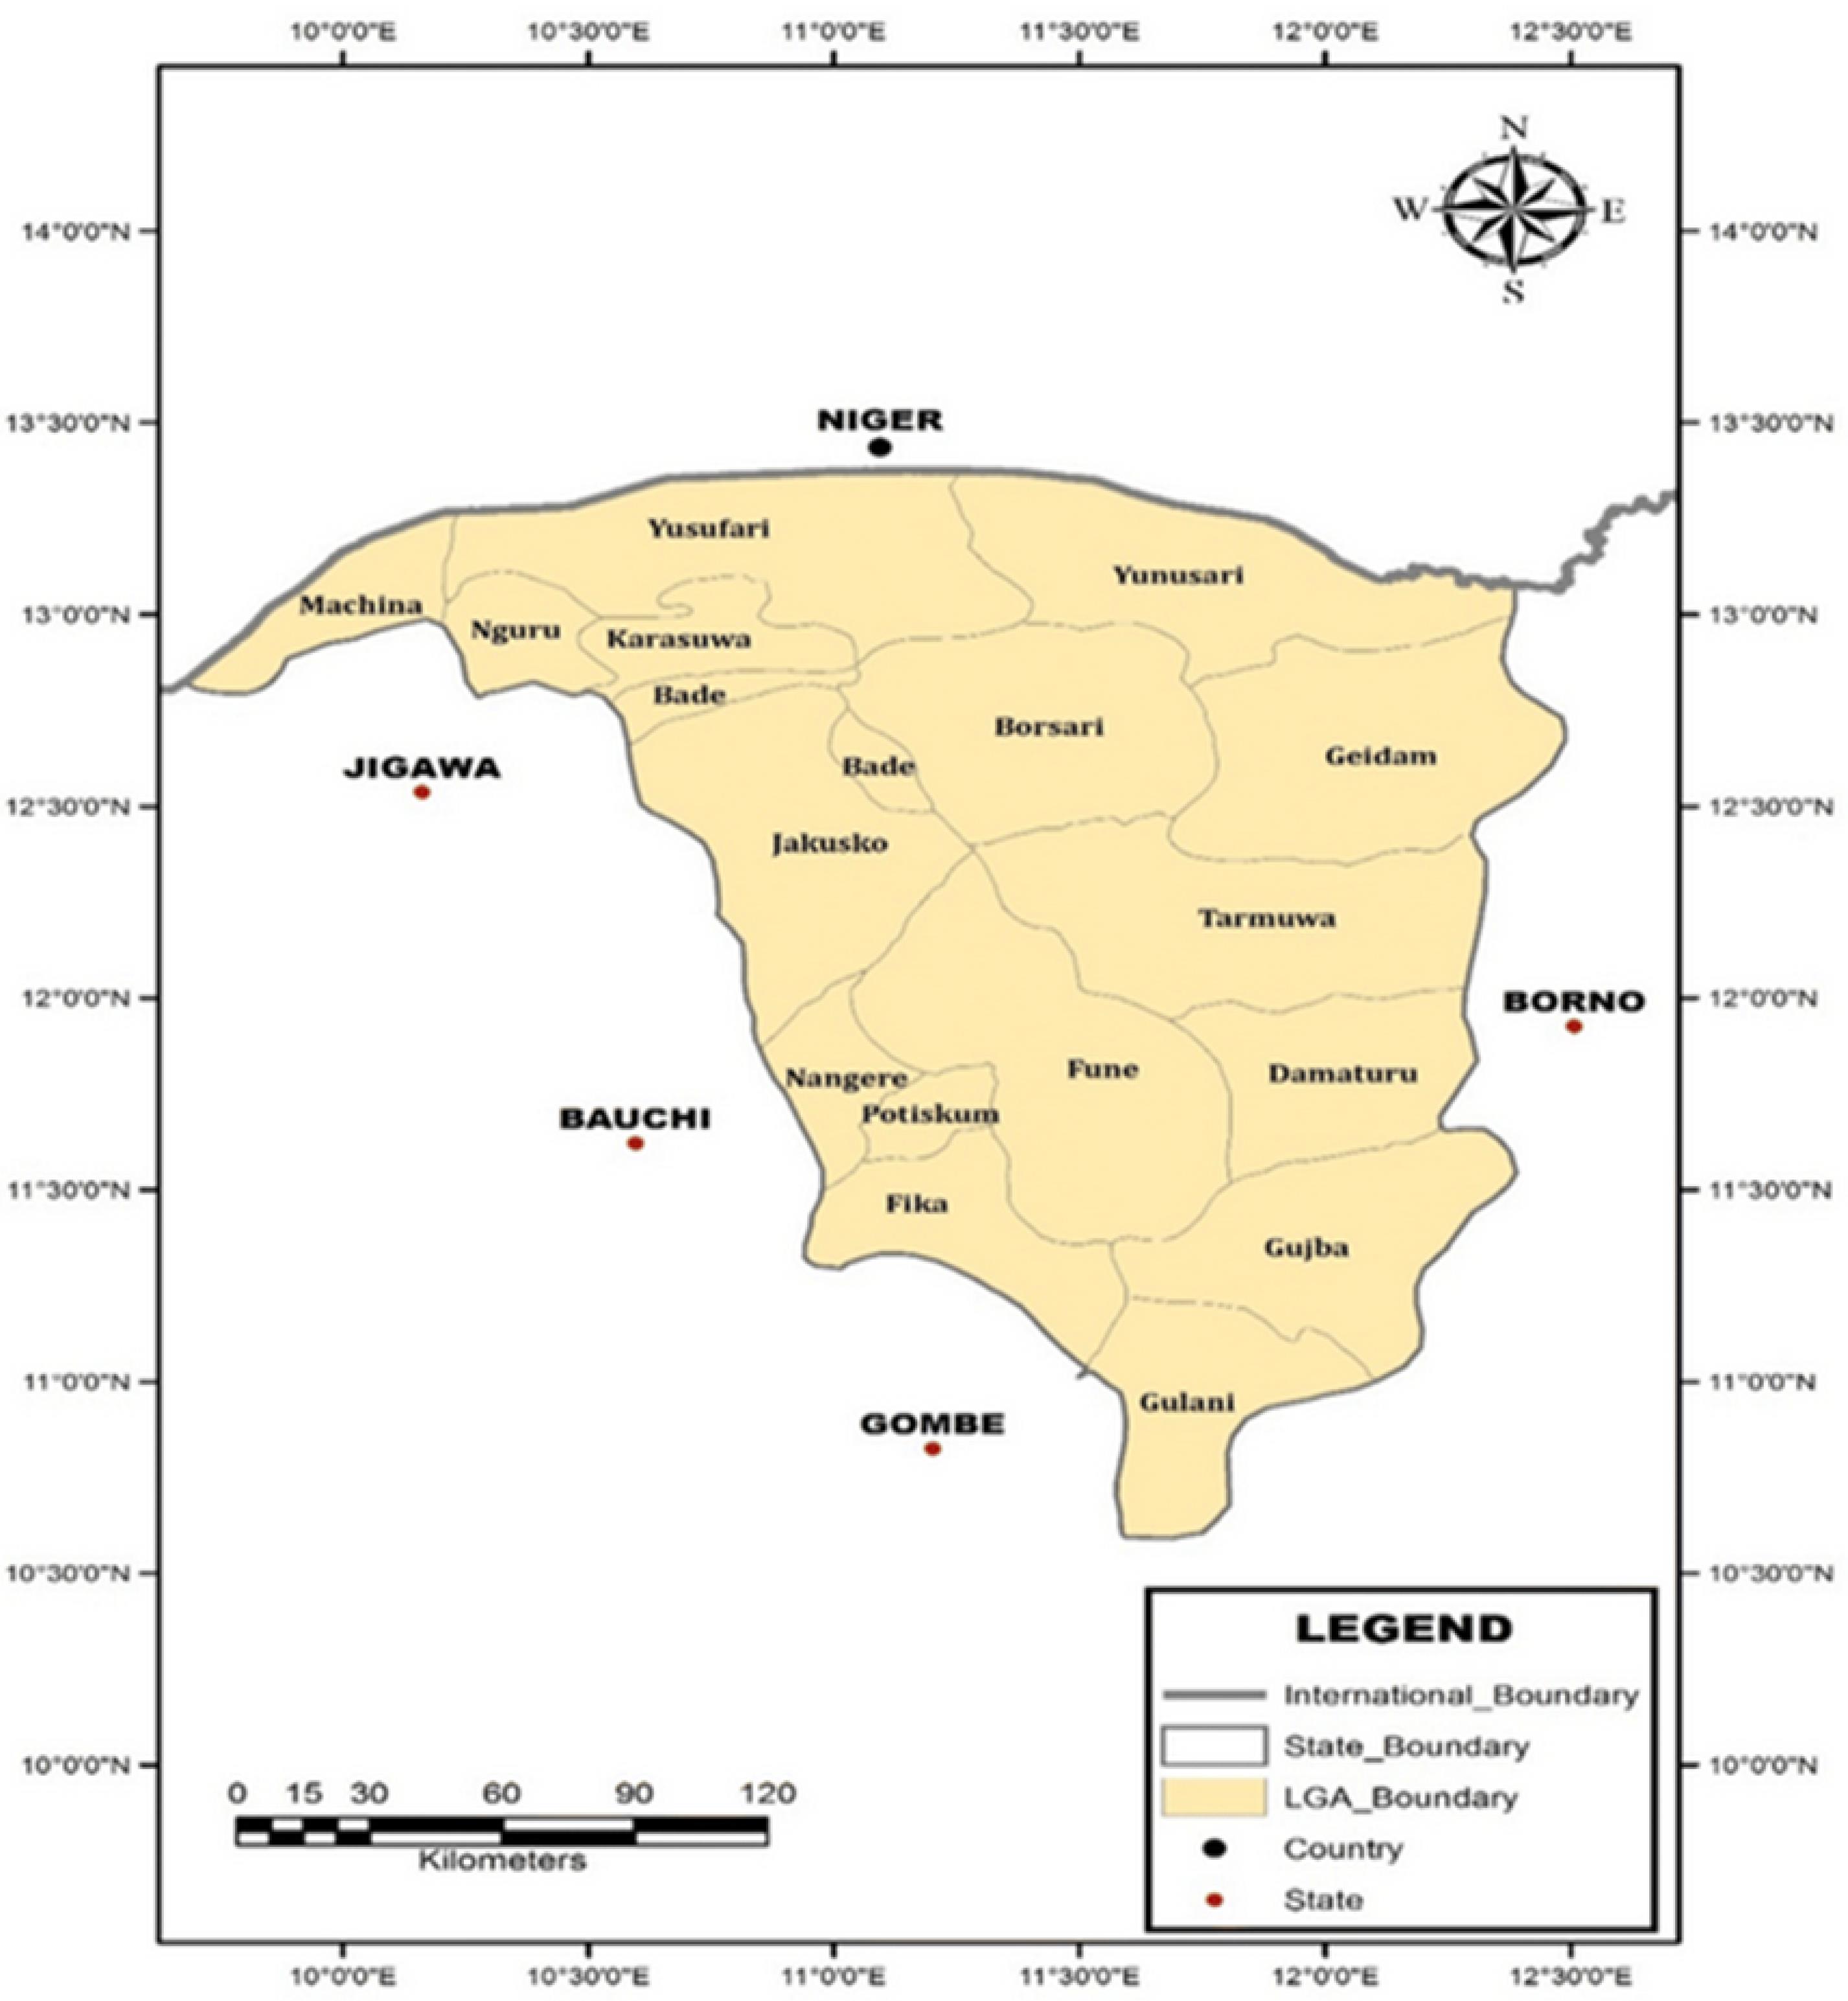
Figure 1.
Map of Yobe State, Nigeria, Showing the Local Government Areas of the State. Source. Geospatial Analysis Mapping and Environmental Research Solutions (GAMERS) 2018. Note. *Areas in red rectangles indicate sites where the samples were collected and studied
.
Map of Yobe State, Nigeria, Showing the Local Government Areas of the State. Source. Geospatial Analysis Mapping and Environmental Research Solutions (GAMERS) 2018. Note. *Areas in red rectangles indicate sites where the samples were collected and studied
Consent and Ethical Approval
The Ministry of Health, Yobe, Operational Research Advisory Committee provided approval to perform the study under reference number MOH/off/797/TI/567. A consent form and questionnaire were administered to each participant prior to sample collection. Those with difficulties in understanding the information were assisted by translating it into the local Hausa dialect.
Sample Size Description
Three hundred patients from three different hospitals in Yobe State (Gashua Specialist Hospital; Federal Medical Center, Nguru; and Government Specialist Hospital, Potiskum) were recruited for this research. Study participants were provided with signed assent and/or informed consent. Patients with complaints of clinical symptoms related to malaria who visited medical clinics in Yobe State, Nigeria, made up the patient population.
Patient Screening and Enrolment
Patients in the age group of 18-50 years with an axillary temperature of > 37°C who had previously suffered from malaria and those who had been on previous treatment with ACT drugs were screened. The patients’ records were tracked from the medical record department. Blood samples were collected via conventional venipuncture without applying excessive pressure to the syringe or arm. On clean, oil-free glass slides, thick as well as thin blood slides were created, and then 3 mL of the whole blood was transferred into anticoagulated (ethylenediaminetetraacetic acid) containers. Plasmodium falciparum was detected using a rapid diagnostic kit (One Step Malaria Antigen P. falciparum [HRP2]). For molecular analysis, the samples were taken on ice to prevent any form of contamination.
Sample Analysis
Rapid Diagnostic Test Strip and Microscopy Method
Only samples with double bands on the strip were used for microscopy analysis. For viewing under the microscope, a thick smear on a clean glass slide was made from a single drop of the blood sample and allowed to dry, and 10% Giemsa staining was applied to the film for 10 minutes. After the completion of the staining period, the film was allowed to dry and viewed under the microscope with an x100 objective (19). The population of P. falciparum was determined and recorded, and only ten plus three ( + + + ) microscopy results were chosen from each hospital, summing up to thirty samples for further analysis.
Extraction of DNA Content of Plasmodium falciparum
The DNA of the P. falciparum parasites was extracted from the whole blood of patients who were + + + positive after microscopy. The QIAamp® DNA Mini Kit (QIAGEN, Hilden, Germany) was used to isolate DNA according to the manufacturer’s instructions.
Confirmation of Plasmodium falciparum Using Cytochrome Oxidase III Polymerase Chain Reaction
Considering that Plasmodium microscopy has limitations, infection was confirmed by the direct PCR approach as reported by Echeverry et al (20). The PCR was conducted using CoxI-F 5’-agcggttaacctttctttttccttacg−3’ and CoxI-R 5’agtgcatcatgtatgacagcatgtt−3’ primers, which target the cytochrome oxidase III (COX III) component of Plasmodium species. A 15 µL solution was created by reconstituting 1 µL of DNA, 1.5 µL of 10 × TaqA Buffer, 0.4 µM (0.5 µL) of forward and reverse primers, 0.63 mM (0.375 µL) of MgCl2, 0.4 mM (0.24 µL) of dNTP mixes, 0.2 µL of Taq DNA polymerase, and 10.66 µL of ddH20. The cycle conditions followed for amplification included an initial denaturation for three minutes at 95 °C, then 35 cycles of one-minute denaturation at 94°C, one-minute primer annealing at 62 °C, and one-minute extension at 72 °C. There was a final extension for 10 minutes at 72 °C. Utilizing ingenious 3 Gel Doc (Syngene, Cambridge, UK), the PCR products were visualized after being separated on a 1.5% agarose gel and dyed with pEqGREEN (GeneOn, Leicestershire, England).
Nested Polymerase Chain Reaction of Kelch13 Gene Fragment
Nest 1 Polymerase Chain Reaction
The forward and reverse primers utilized in this study were kelch-out-F (5′-gggaatctggtggtaacagc-3′) and kelch-out-R (5′-cggagtgaccaaatctggga-3′). Then, 2 μL of the genomic DNA, 10 μL of a master mix (Promega, USA) consisting of a buffer, MgCl2, and dNTPs, 1 μL of each of the forward and reverse primers, and 6 μL of nuclease-free water were used to make up a 20 μL final volume PCR constitution. This was followed by an initial denaturation at 95 °C for one minute, 35 cycles of 20 seconds at 95 °C for denaturation, 20 seconds at 57 °C for primer annealing, and 1.5 minutes at 60 °C for extension. A final extension lasted three minutes at 60 °C. The PCR products were visualized on a 1.5% agarose gel after being stained with ethidium bromide.
Nest 2 Polymerase Chain Reaction
The forward and reverse primers used were kelch-in-F (5′-gccttgttgaaagaagcaga-3′) and kelch-in-R (5′-gccaagctgccattcatttg-3′). PCR was performed in a 20 μL final volume comprising 2 μL of the genomic DNA, 10 μL of master mix (Promega, USA), 1 μL of each of the forward and reverse primers, and 6 μL of nuclease-free water. The same PCR conditions employed in the Nest 1 PCR, as described above, were maintained. Finally, the PCR products were separated in a 2% agarose gel stained with ethidium bromide and visualized.
Purification of Nest 2 Polymerase Chain Reaction products
The QIAquick® PCR Purification Kit (QIAGEN, Germany) was utilized to purify Nest 2 products following the manufacturer’s instructions.
Data Analysis
SNPs in amino acids from multiple sequence alignments were manually examined using Bioedit version 7.2.3.0 (21) and CLC sequence viewer version 8.0 (http://www.clcbio.com/). DnaSP 6.12.3 was used to calculate several genetic variables, including the number of haplotypes (h) and diversity (Hd), the number of polymorphic sites (S) and nucleotide diversity (π), Fu and Li’s D, and Tadjimas D (22). Several haplotypes were compared using MEGA 10.2.6 to create a phylogenetic tree (23). Population Analysis with Reticulate Trees (PopART, version 1.7) was utilized to build the TCS haplotype network (24).
Results
Microscopy and Rapid Diagnostic Test Results
Out of the 300 samples screened, 204 were positive with rapid diagnostic strips. For the microscopy using Giemsa-staining techniques, the number of positive samples (n = 204) was reduced to a total of 174. Overall, 96 out of the 174 samples were negative, and 83 samples were three plus positive (Table 1).
Table 1.
Depicting Positive (Using Both RDT and Microscope) and Negative Samples in Gashua, Nguru, and Postiskum
|
Sites of Study
|
RDT Positive,
n (%)
|
Positive Sample (Microscope),
n (%)
|
Negative Sample
(Microscope), n (%)
|
Three Plus Samples (+++)
(Microscope), n (%)
|
| Gashua |
69 (33.82) |
52 (29.89) |
31 (32.30) |
21 (25.30) |
| Nguru |
80 (39.21) |
75 (43.10) |
20 (20.83) |
42 (50.60) |
| Potiskum |
55 (26.96) |
47 (27.01) |
45 (45.96) |
20 (24.09) |
| Total |
204 |
174 |
96 |
83 |
Note. No.: Number; RDT: Rapid diagnostic test; + + + indicates a high level of parasitaemia.
Confirmation of the Presence of P. falciparum Using the COXIII Gene Polymerase Chain Reaction
Based on the gel electrophoresis results of the COXIII PCR of some selected samples (Figure 2), DNA bands appeared at 540 bp.
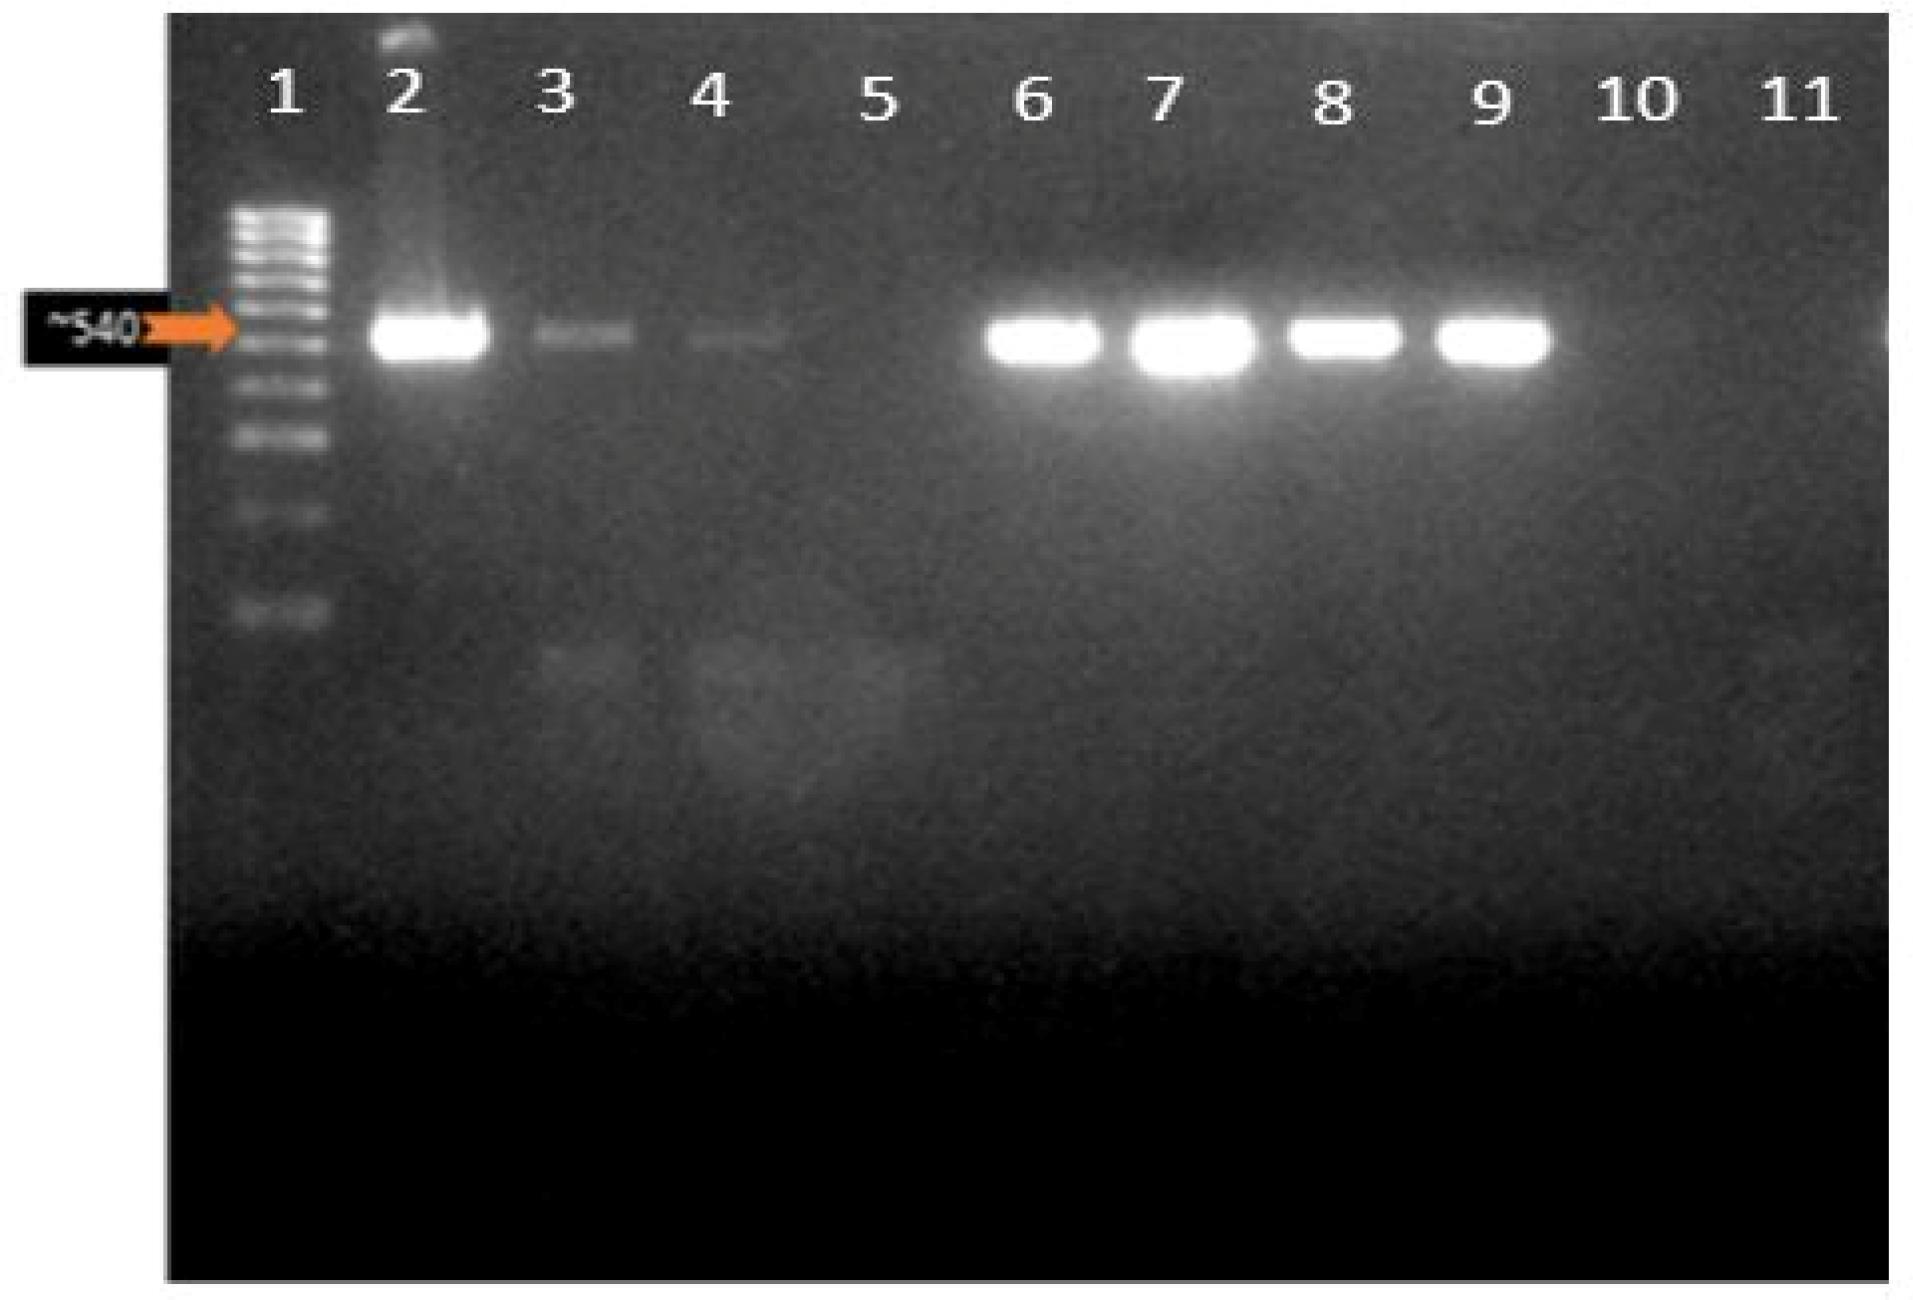
Figure 2.
COXIII PCR Confirmation of Plasmodium Infection. Note. PCR: Polymerase chain reaction; COXIII: Cytochrome oxidase III. Lane 1: Molecular ladder (Hyper ladder IV: 50-1013 bp); Lanes 2–9: 500 bp representing the COXIII gene band of the malaria parasite for the confirmation of malaria parasitemia in microscopy positive patients; Lanes 5 and 10 have no band indicating a negative result, while lane 11 is a negative control (NTC) in which ddH20 was added
.
COXIII PCR Confirmation of Plasmodium Infection. Note. PCR: Polymerase chain reaction; COXIII: Cytochrome oxidase III. Lane 1: Molecular ladder (Hyper ladder IV: 50-1013 bp); Lanes 2–9: 500 bp representing the COXIII gene band of the malaria parasite for the confirmation of malaria parasitemia in microscopy positive patients; Lanes 5 and 10 have no band indicating a negative result, while lane 11 is a negative control (NTC) in which ddH20 was added
Nested Polymerase Chain Reaction Amplification Results
The PCR products of the Kelch13 gene fragment of Nest 1 PCR were found to be 2097 bp (Figure 3a). In Nest 2, 849 bp fragment falls in the 1279–2127 nucleotide positions of BTB and six blades of the propeller domains; codons 427–709 (Figure 3b).
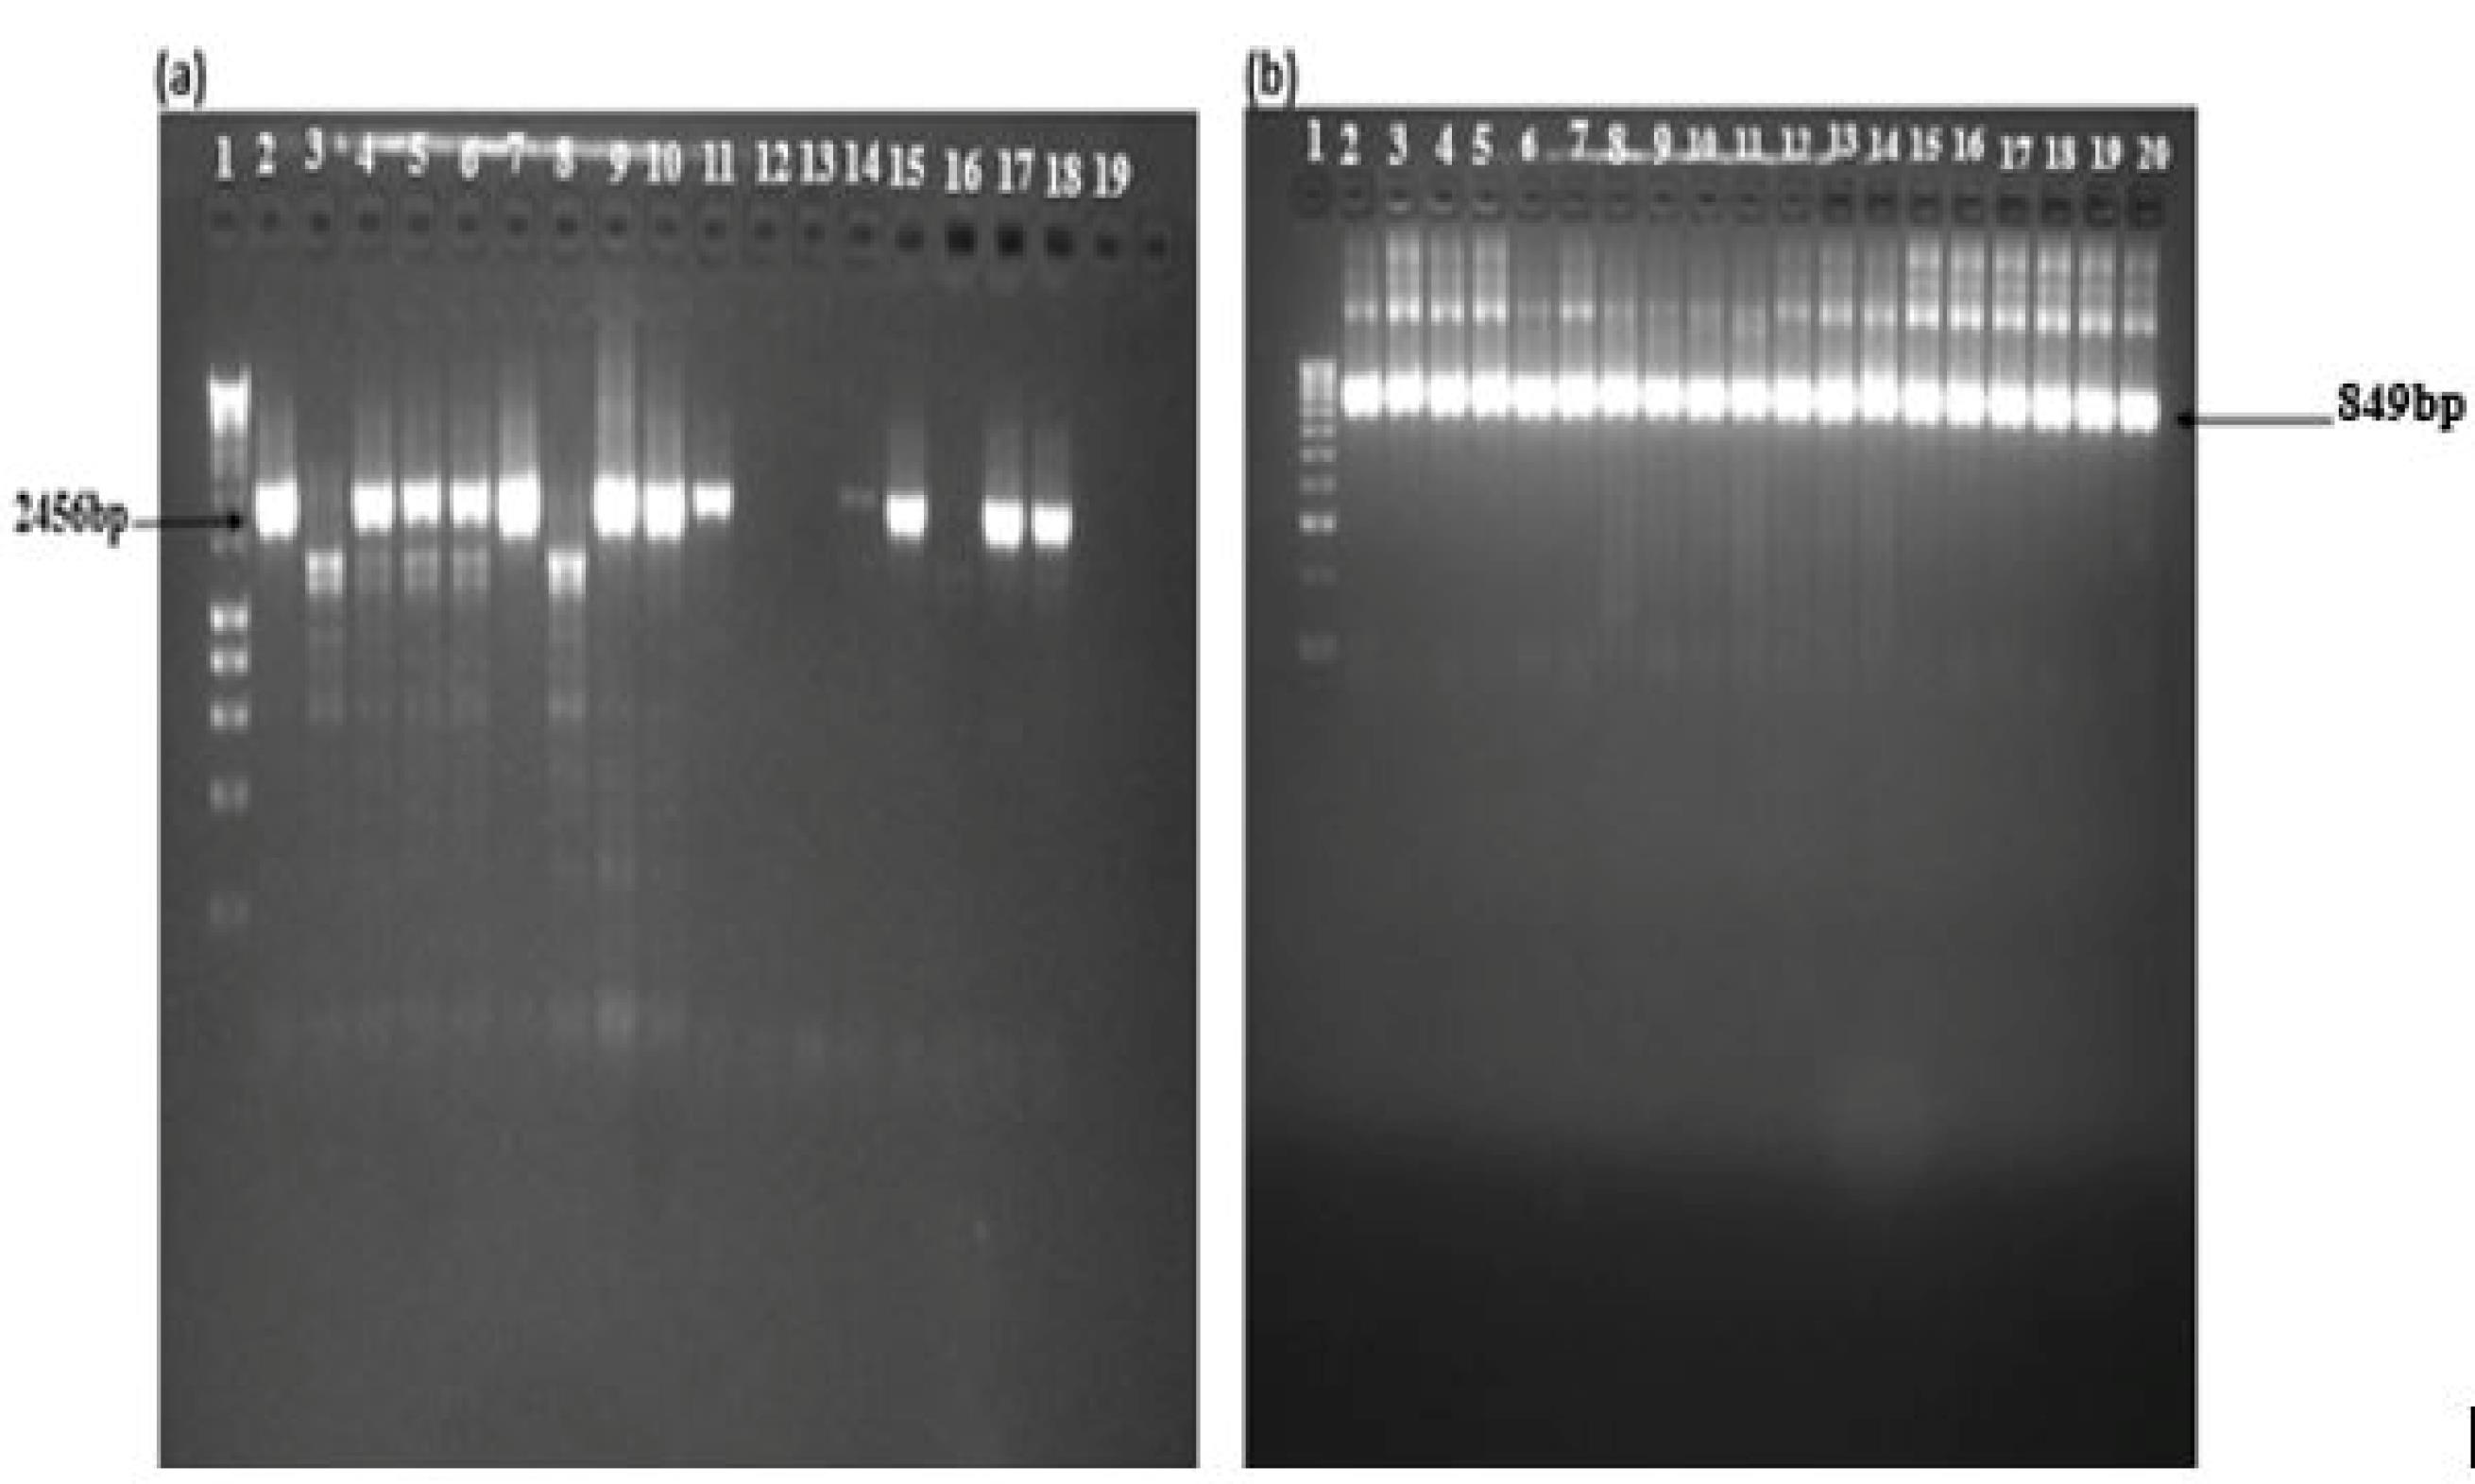
Figure 3.
Gel Images of Nests 1 and 2. Note. (a) Nest 1: Lane 1: Molecular ladder (Hyper ladder 1, 200 bp-10 kb); Lanes 2, 4, 5, 6, 7, 9, 10, 11, 14, 15, and 17 represent samples from malaria-infected individuals with 2459 bp fragment and (b) Nest 2: Lane 1: Molecular ladder (Hyper ladder IV, 50–1013 bp); Lanes 2–19: Band size of 849 bp, corresponding to the Kelch13 propeller domain of Plasmodium falciparum isolates from the blood samples of malaria-infected individuals.
.
Gel Images of Nests 1 and 2. Note. (a) Nest 1: Lane 1: Molecular ladder (Hyper ladder 1, 200 bp-10 kb); Lanes 2, 4, 5, 6, 7, 9, 10, 11, 14, 15, and 17 represent samples from malaria-infected individuals with 2459 bp fragment and (b) Nest 2: Lane 1: Molecular ladder (Hyper ladder IV, 50–1013 bp); Lanes 2–19: Band size of 849 bp, corresponding to the Kelch13 propeller domain of Plasmodium falciparum isolates from the blood samples of malaria-infected individuals.
Sequencing and Polymorphism Analysis
Multiple sequence alignments constructed using the CLC viewer revealed mutations at different nucleotide positions (350–442, BTB/POZ, and 442–475; Blade 1: 475–527; Blade 2: 527–574; Blade 3: 574–614; Blade 4: 614–666; Blade 5: 666–727; Blade 6). The highlighted regions are the mutant amino acids. Most of the mutations are situated at the 6th blade. Figures 4a and 4b show the alignment of the amino acid sequence of the genomic isolates with the reference sequence obtained from the National Center for Biotechnology Information (with accession number MT263355.1). Yellow-labelled amino acids denote points of mutation from the Pf_3D7.
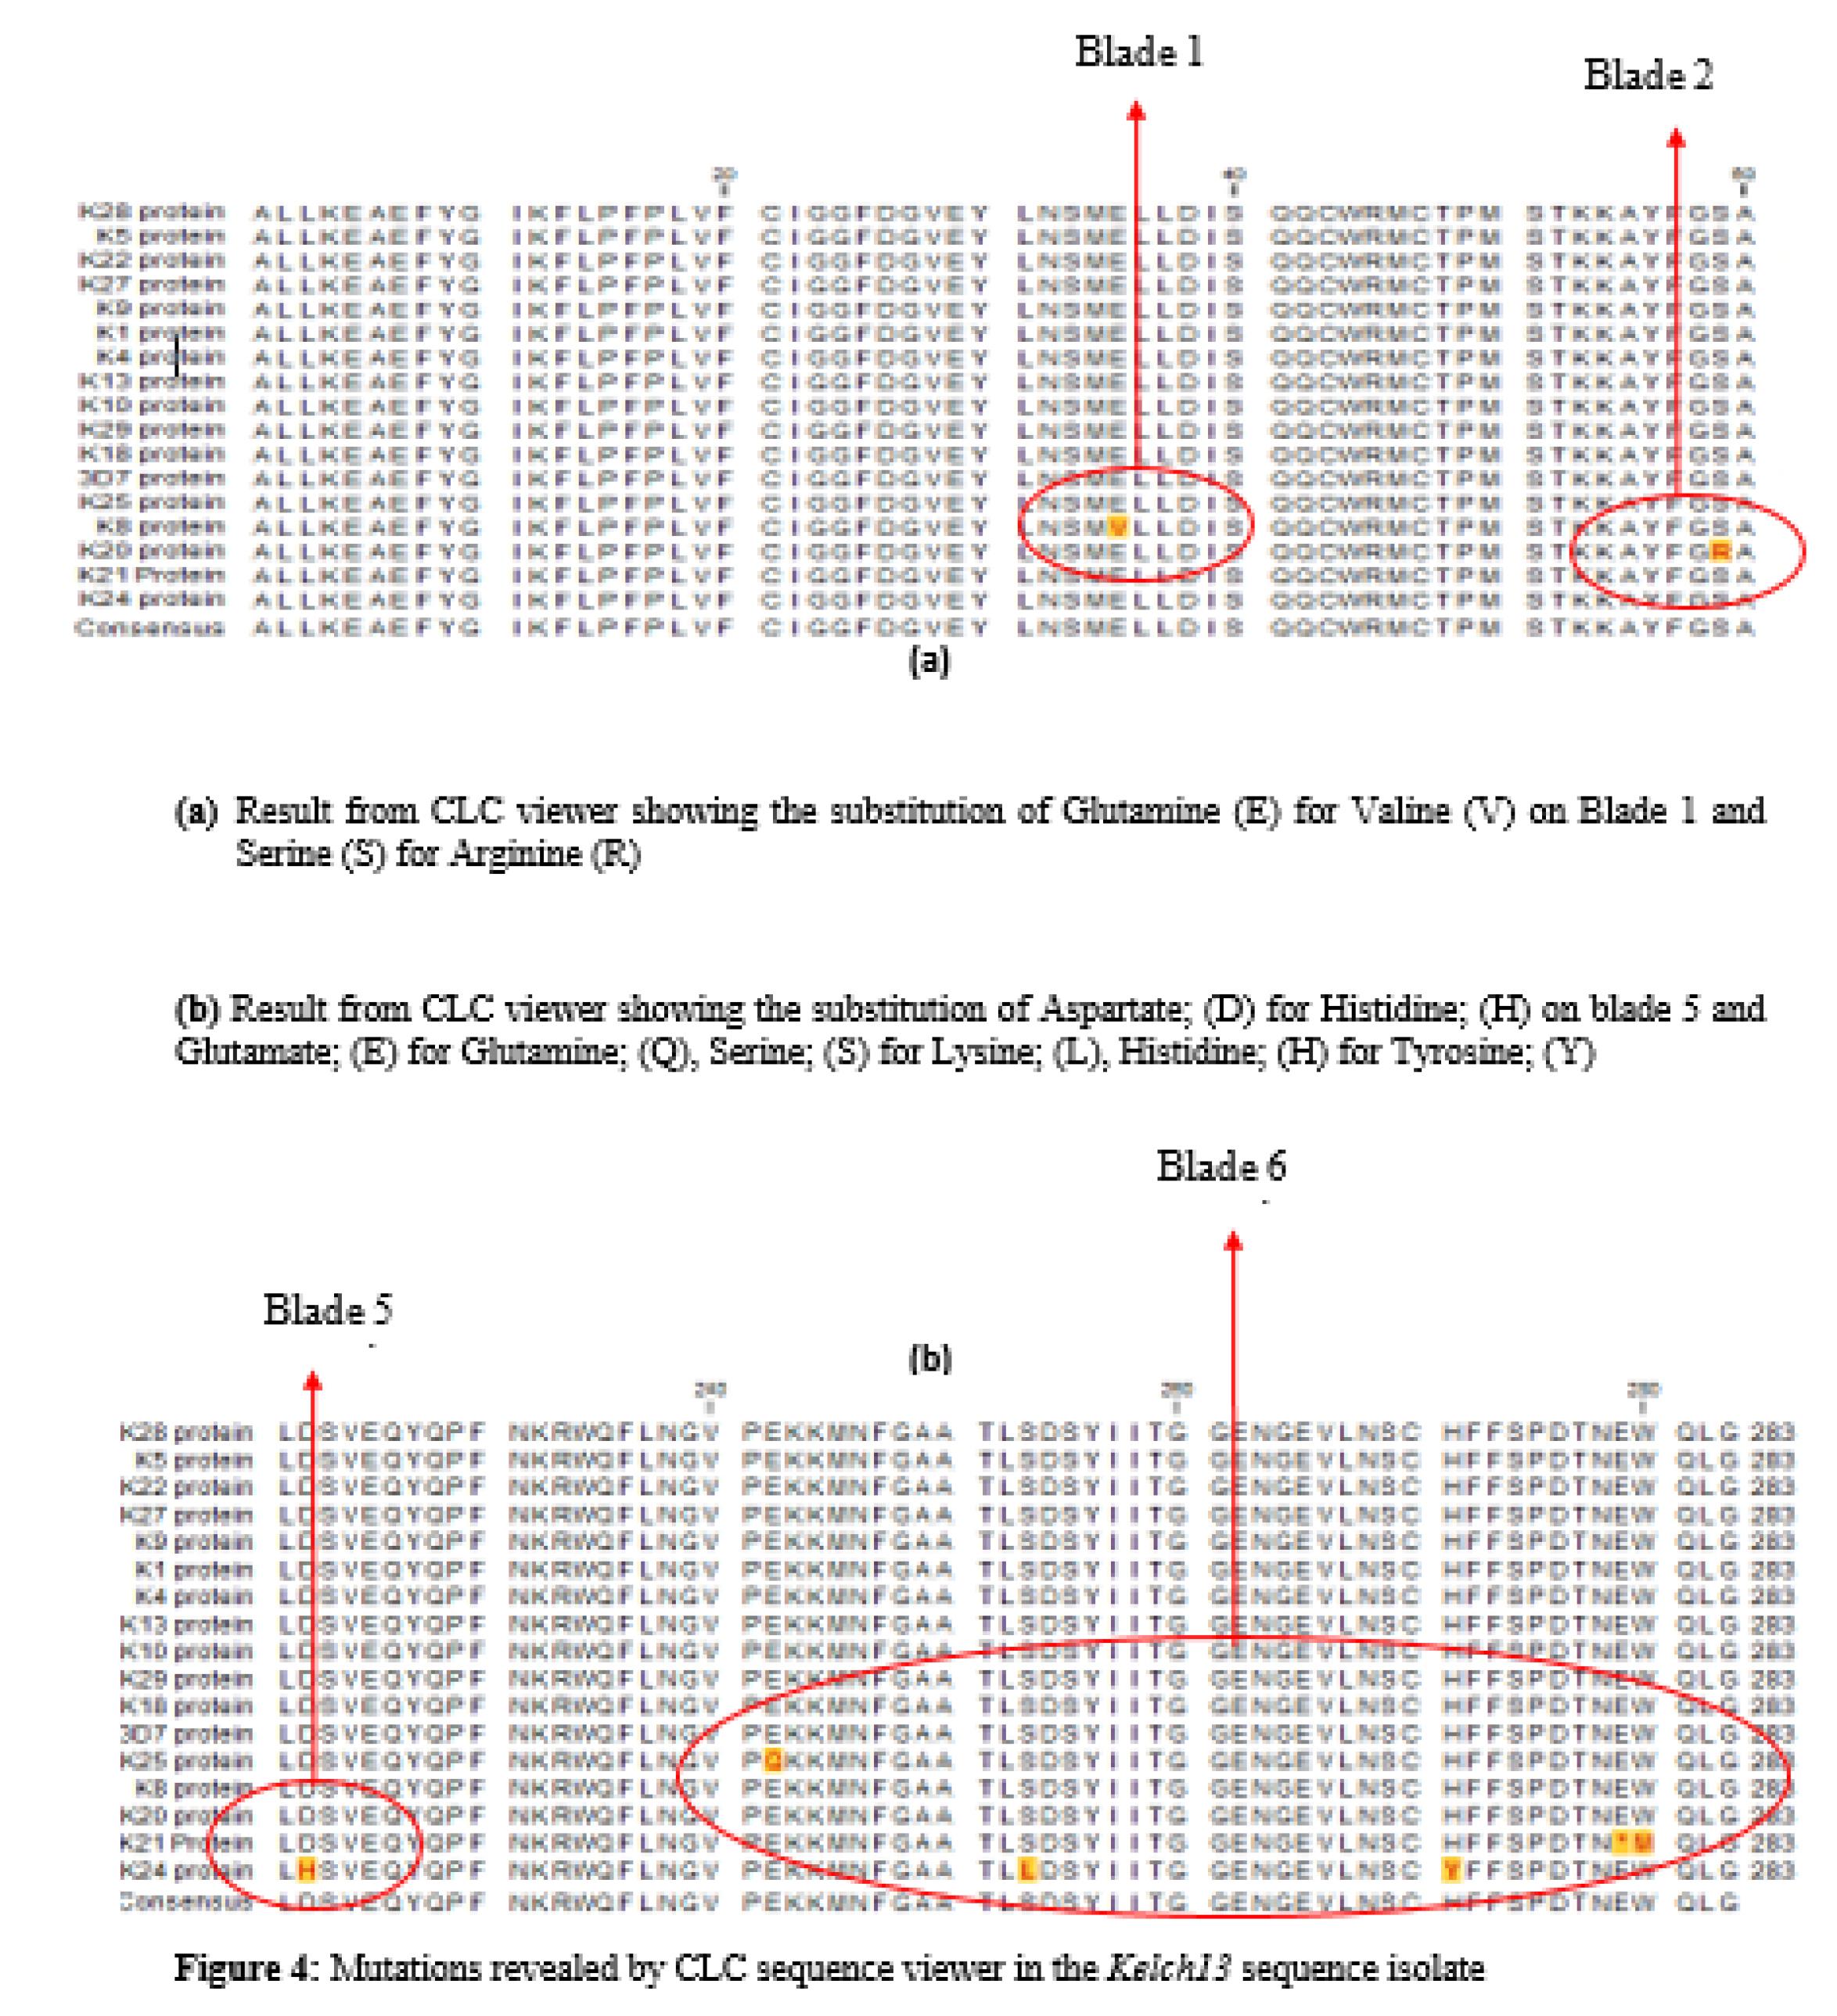
Figure 4.
Mutations Revealed by the CLC Sequence Viewer in Kelch13 Sequence Isolates. (a) Results From CLC Viewer Showing the Substitution of Glutamine (E) for Valine (V) on Blade 1 and Serine (S) for Arginine (R). (b) Results From CLC Viewer Displaying the Substitution of Aspartate, (D) for Histidine, (H) on Blade 5 and Glutamate, (E) for Glutamine, (Q) Serine, (S) for Lysine, (L) Histidine, and (H) for Tyrosine
.
Mutations Revealed by the CLC Sequence Viewer in Kelch13 Sequence Isolates. (a) Results From CLC Viewer Showing the Substitution of Glutamine (E) for Valine (V) on Blade 1 and Serine (S) for Arginine (R). (b) Results From CLC Viewer Displaying the Substitution of Aspartate, (D) for Histidine, (H) on Blade 5 and Glutamate, (E) for Glutamine, (Q) Serine, (S) for Lysine, (L) Histidine, and (H) for Tyrosine
Loci for Amino Acid Substitutions in Sequence Traces
Nine novel mutations were discovered (Table 2), seven of which (E461V, S485R, D648H, E668Q, S679L, H697Y, and W706M) were NS, while two (S485S and A675A) were synonymous. This is due to the redundant nature of codons of amino acids.
Table 2.
The Codons of the 9 Mutations: 2 Synonymous and 7 Non-synonymous
|
Domain/Propeller
|
Wild Type Codon
|
Nucleotide Position
|
Mutation Observed
|
Sequence(s) With Changes
|
Type of Mutation
|
| BTB/POZ |
- |
- |
- |
- |
- |
| Blade 1 |
GAA |
GTA |
Glu461Val |
K_8 |
NS |
| Blade 2 |
AGT |
AGC |
Ser485Ser |
K_4, K_27 |
S |
| Blade 2 |
AGT |
AGG |
Ser485Arg |
K_20 |
NS |
| Blade 3 |
- |
- |
-
|
- |
- |
| Blade 4 |
- |
- |
-
|
- |
- |
| Blade 5 |
GAT |
CAT |
Asp648His |
K_24 |
NS |
| Blade 6 |
GCT |
GCG |
Ala675Ala |
K_24 |
S |
| Blade 6 |
GAG |
CAG |
Glu668Gln |
K_25 |
NS |
| Blade 6 |
TCA |
TTA |
Ser679Leu |
K_24 |
NS |
| Blade 6 |
CAT |
TAT |
His697Tyr |
K_24 |
NS |
| Blade 6 |
TGG |
ATG |
Trp706Met |
K_21 |
NS |
Note. NS: Non-synonymous; S: synonymous; Key: aa: Amino acid; BTB/POZ: Nt: Nucleotide; A: Alanine; D: Aspartic acid; E: Glutamic acid; H: Histidine; I: Isoleucine K: Lysine; L: Leucine; M: Methionine; W: Tryptophan; M: Methionine; K: Lysine; Q: Glutamine; R: Arginine; S: Serine; V: Valine; Y: Tyrosine.
Placement of Novel Mutation on Simulated Model of the Kelch13 Gene With Validated Mutations of the World Health Organization
None of the mutations conform to any of the WHO-validated mutations. Figure 5 depicts both novel mutations and the 5 most occurring mutations confirmed by the WHO.
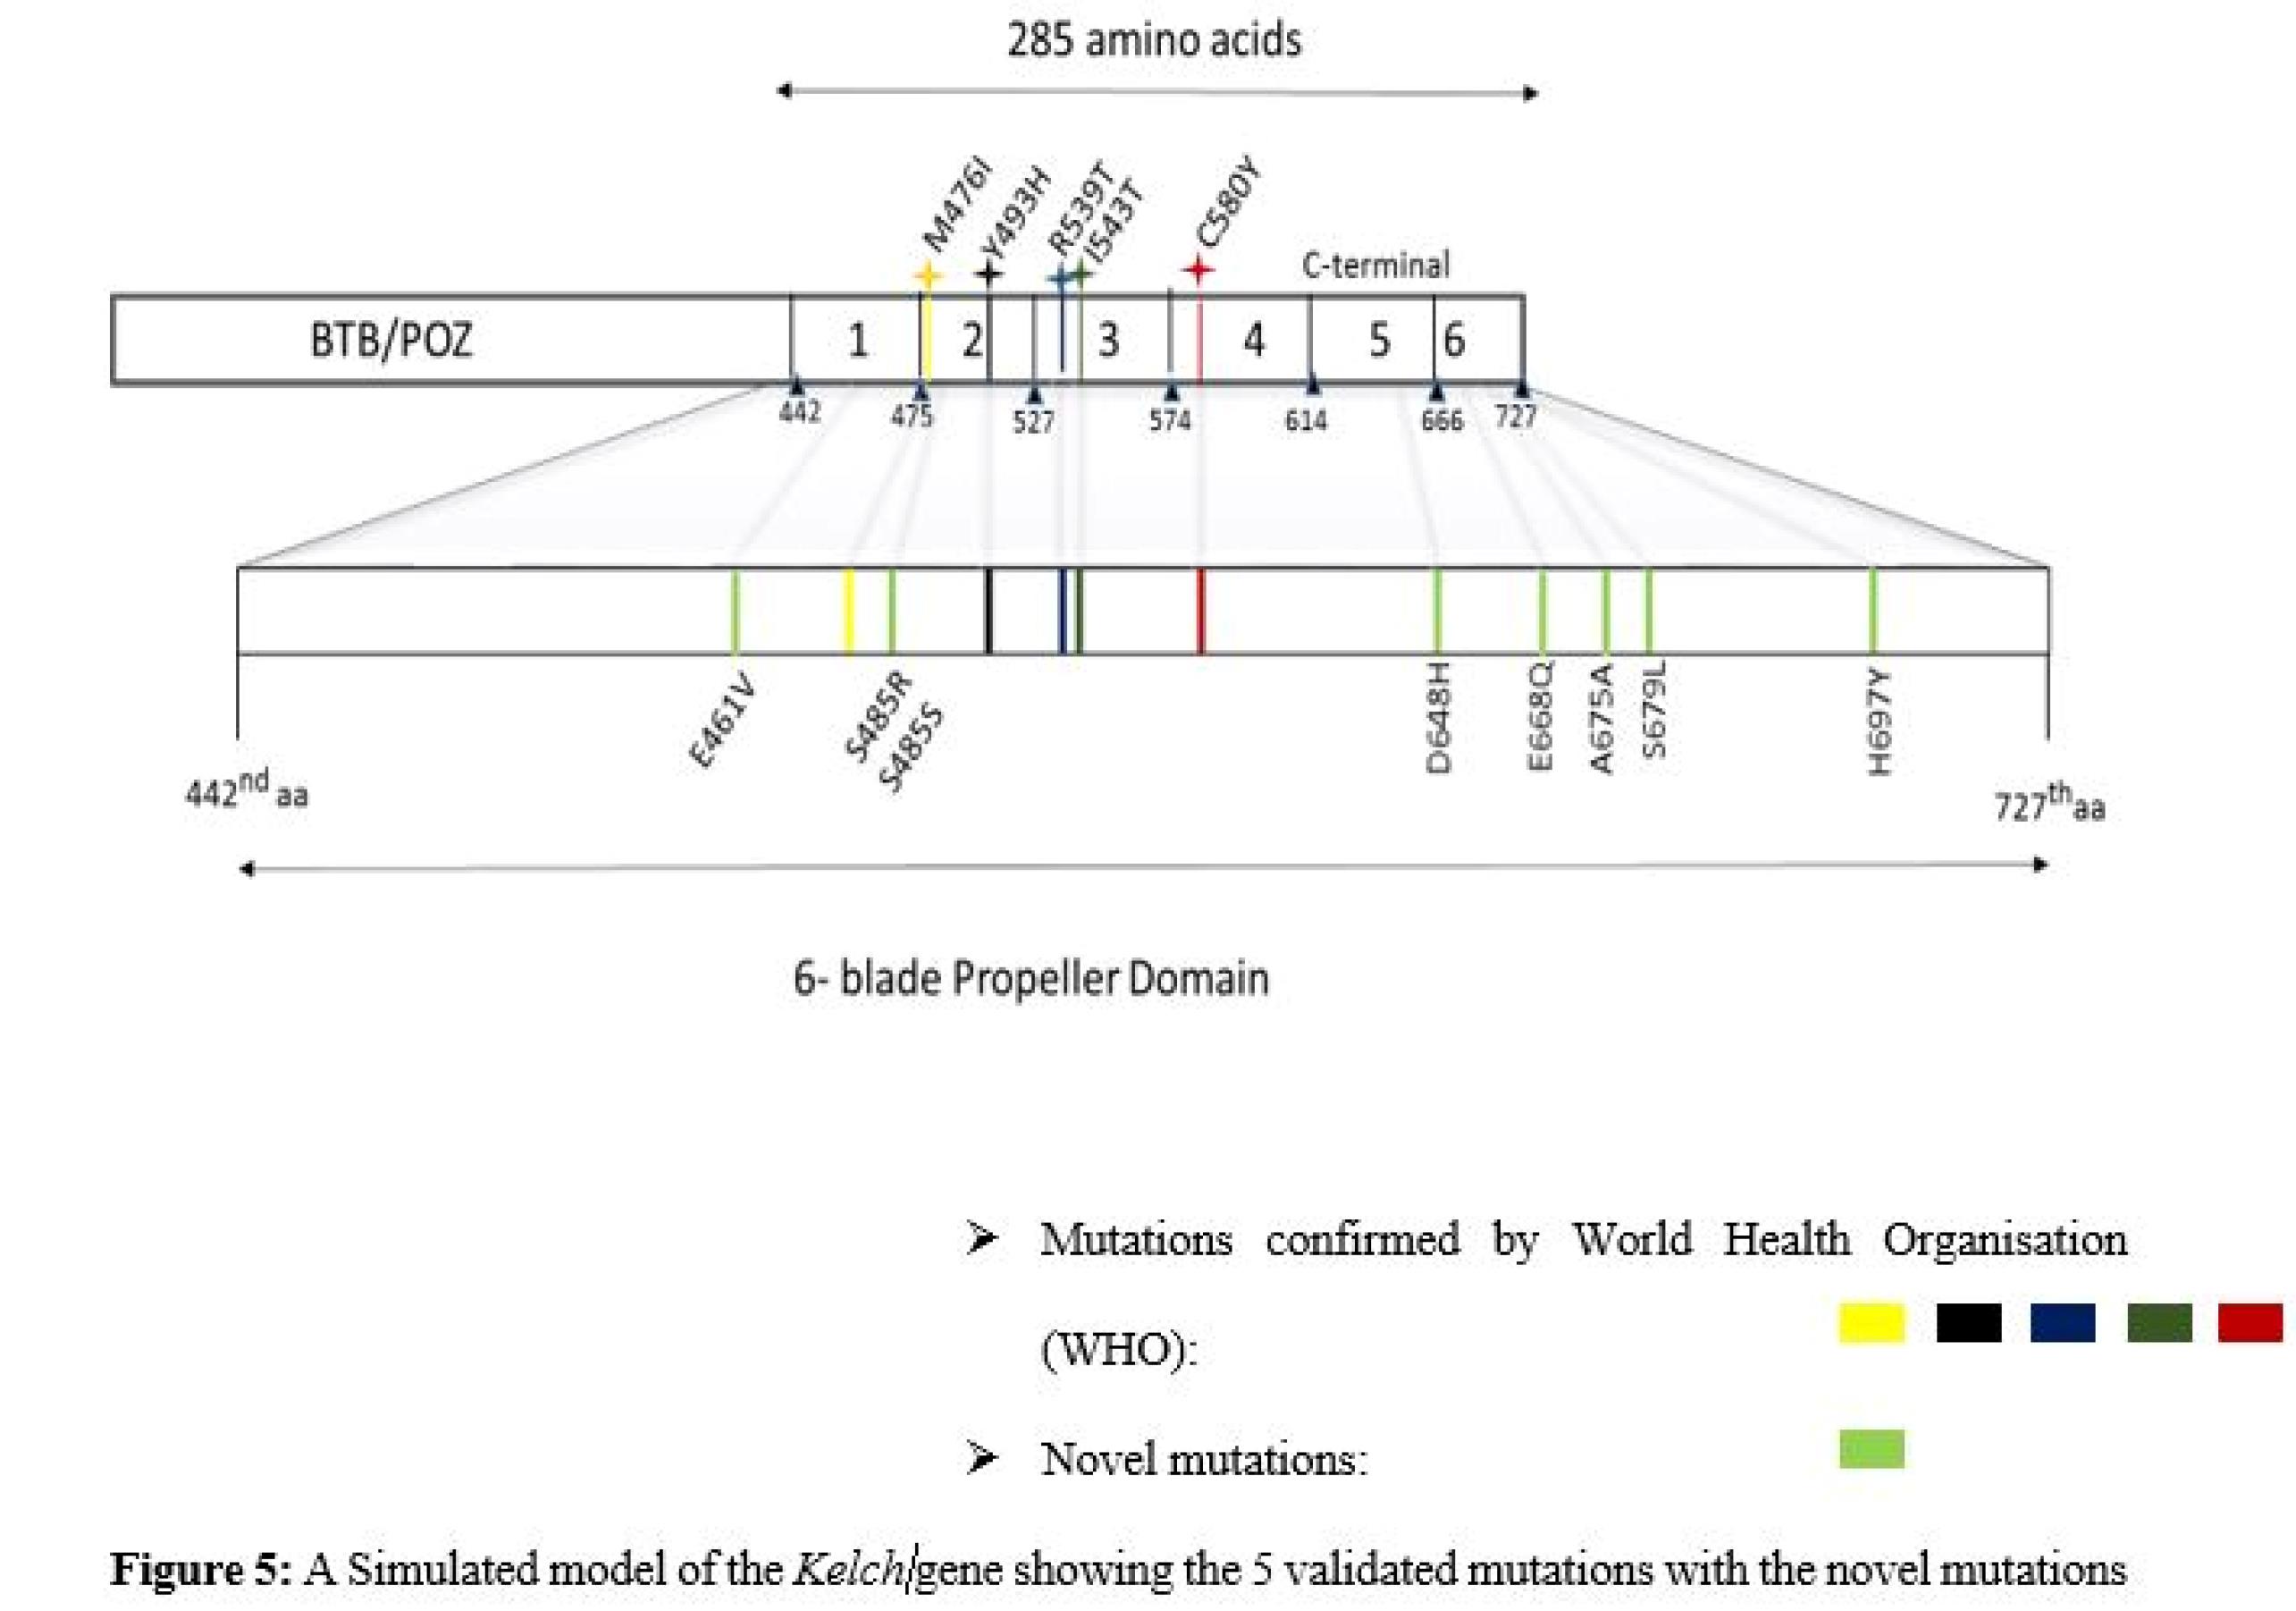
Figure 5.
A Simulated Model of the Kelch Gene Showing the 5 Validated Mutations With Novel Mutations
.
A Simulated Model of the Kelch Gene Showing the 5 Validated Mutations With Novel Mutations
Genetic Variability in the Kelch13 Fragment
DnaSp was used to evaluate the statistical parameters of the 17 sequences under study (Table 3). Seven haplotypes were discovered with haplotype diversity (Hd = 0.662). Values of D (Tadjima) and D* (Fu and Li) were computed at P > 0.01 statistical significance. The haplotype frequencies were also computed using DnaSP.
Table 3.
Results of Genetic Diversity Generated Using DnaSP
|
Location
|
N
|
S
|
H
|
H
d
|
π (k)
|
D (Tadjima)
|
D* (Fu and Li)
|
| All |
17 |
11 |
7 |
0.662 |
0.00177 |
-2.16692sig |
-3.08435sig |
Note. N: Total sequence traces analyzed; S: Polymorphic sites; h: Haplotypes; Hd: Haplotype diversity; π: Nucleotide diversity (k = mean number of nucleotide differences).
Establishment of Evolutionary Distance
The 17 sequences were subjected to sequence alignment using MEGA X (version 10.2.6) to construct a phylogenetic tree (23) (Figure 6). According to the tree construct, the most genetically divergent sequences that harbor mutations that render them different from the reference 3D_7 included K_8, K_21, K_25, K_20, K_4, K_27, and K_24. K_24 is the outgroup on which the root links with other more closely related sequences (Figure 7).
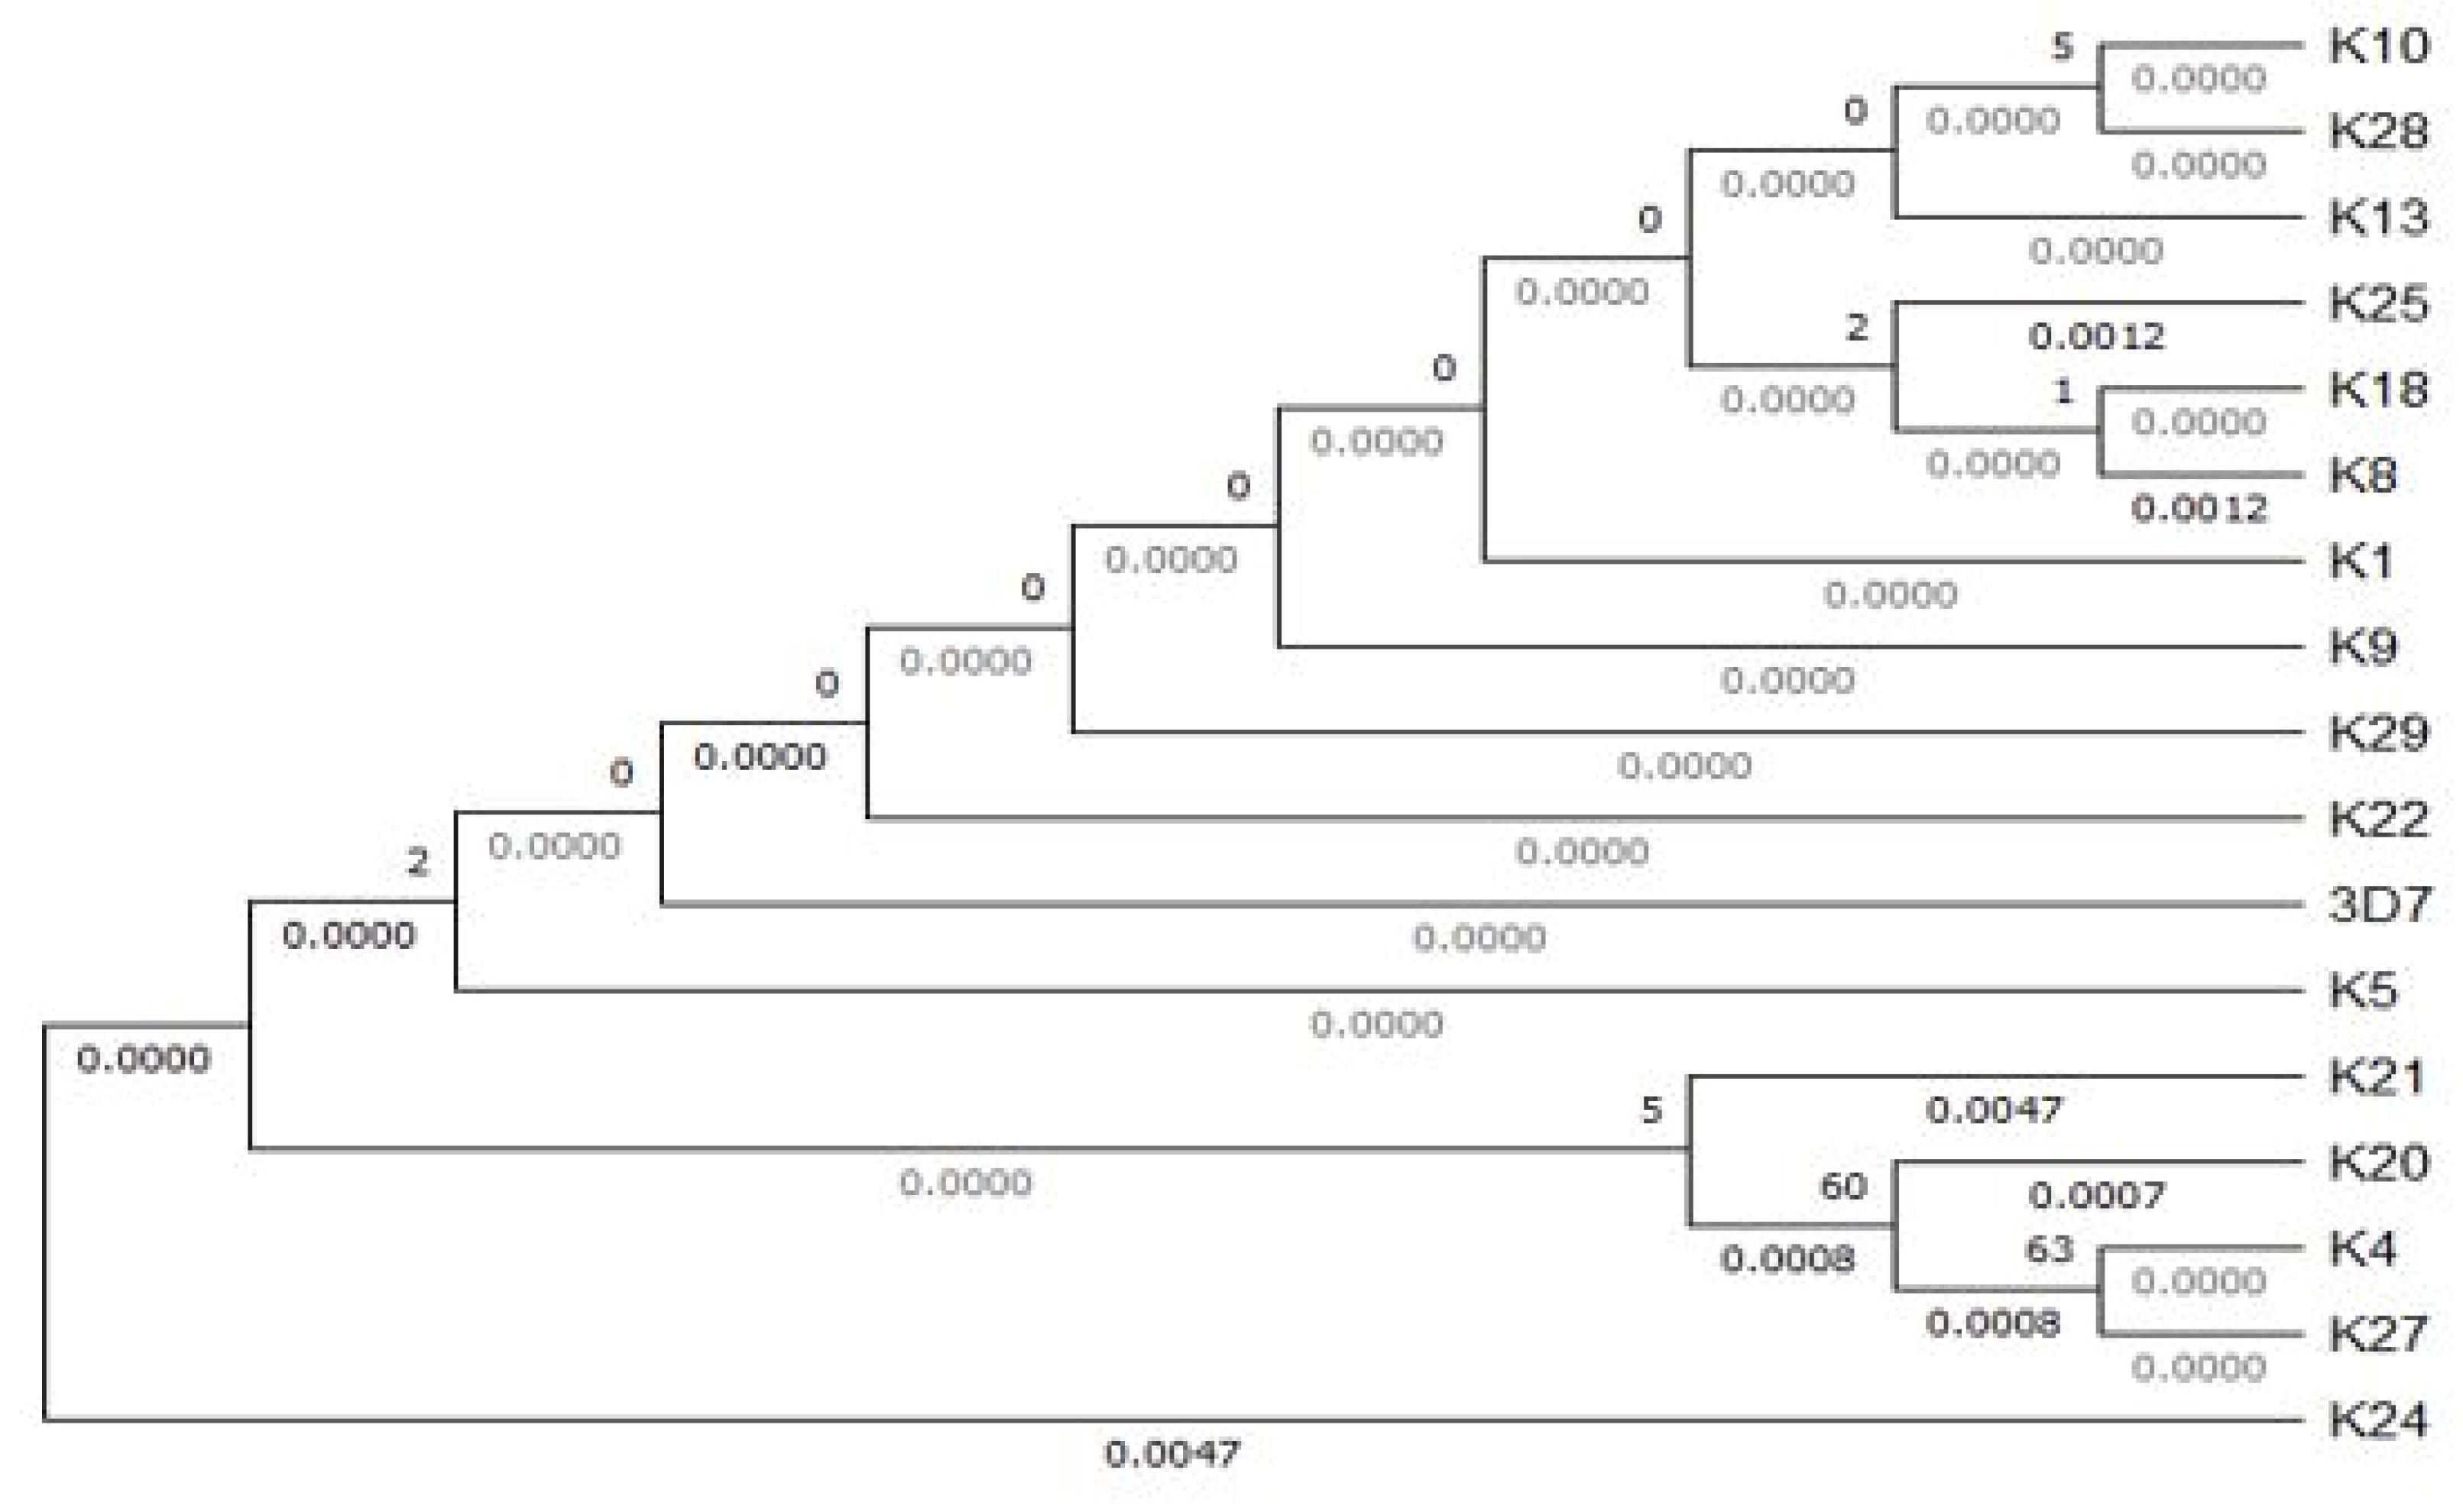
Figure 6.
Phylogenetic Tree Showing the Distance Among Field Isolates and 3D_7
.
Phylogenetic Tree Showing the Distance Among Field Isolates and 3D_7
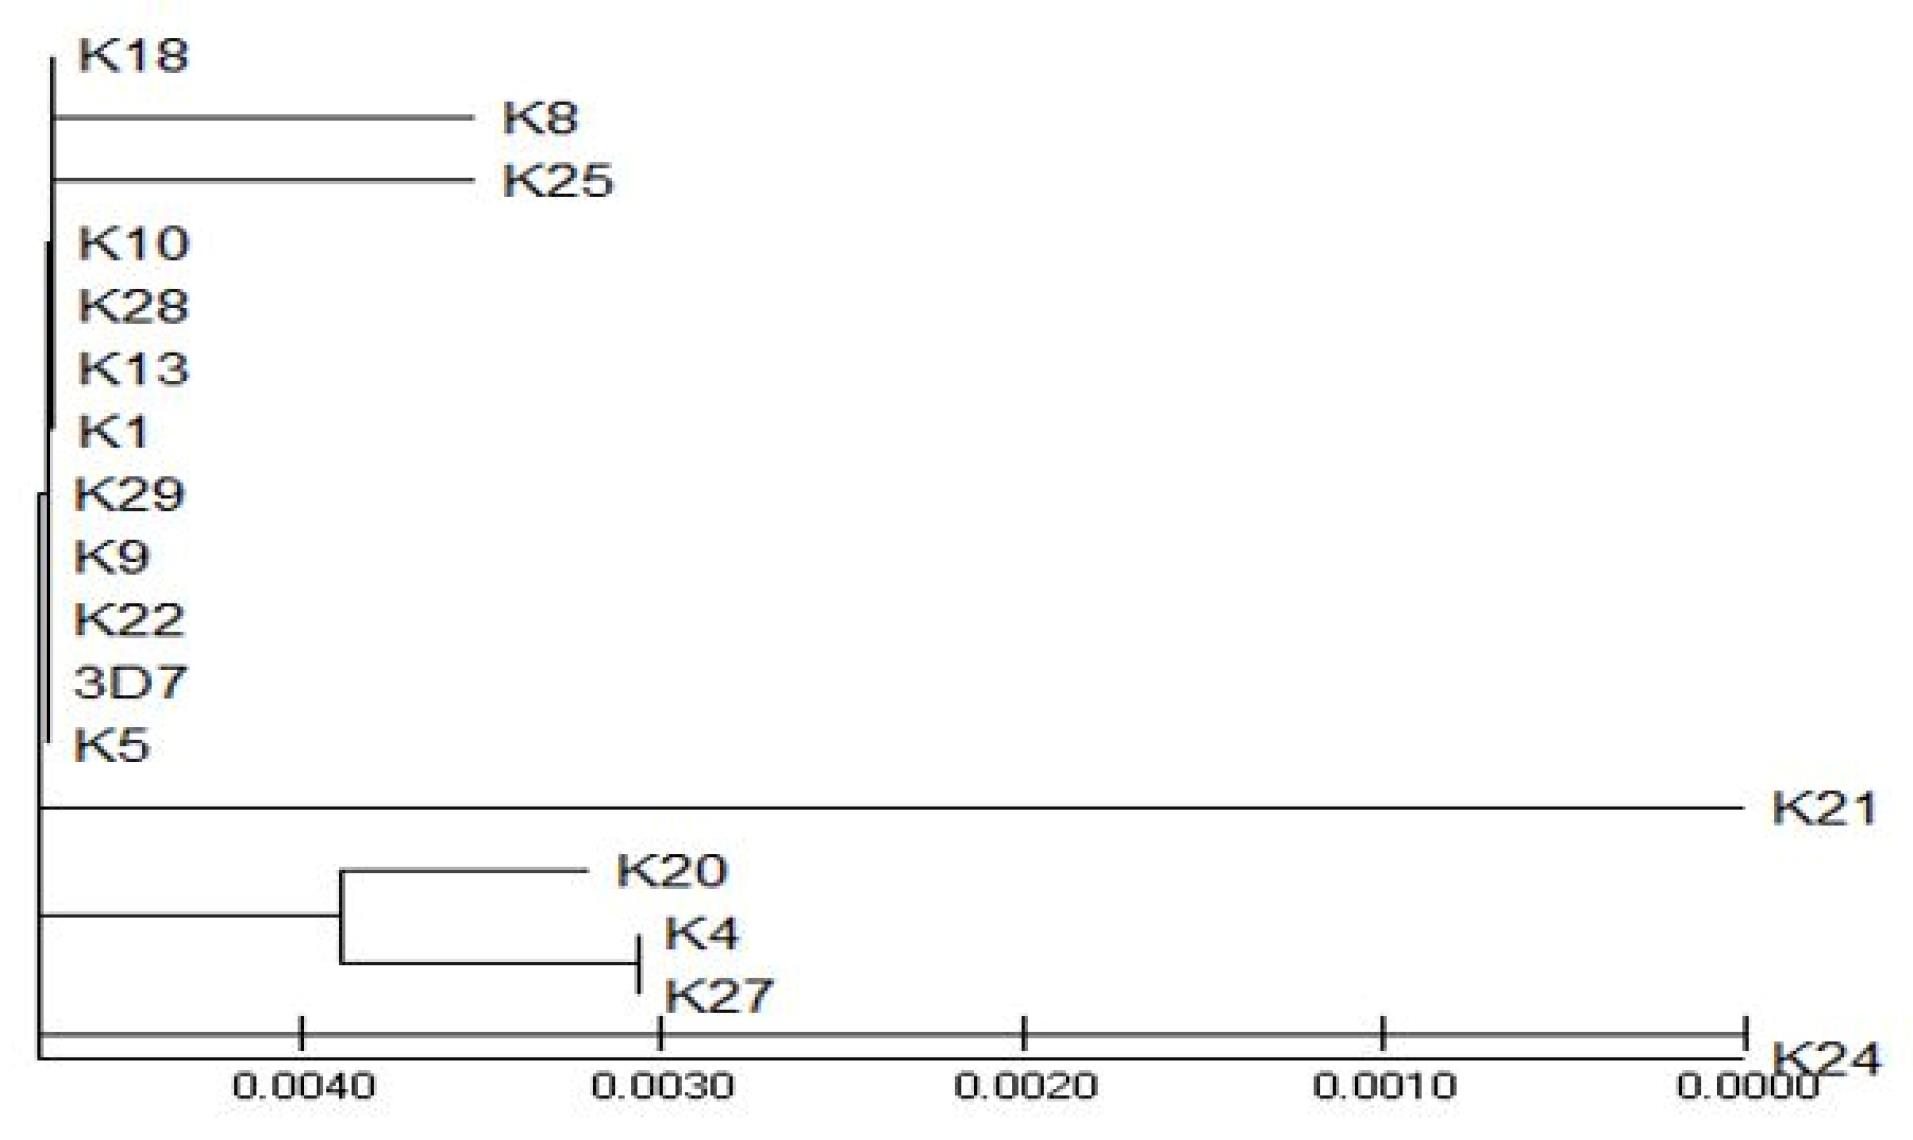
Figure 7.
A Topological View of the Tree Illustrating the Outgroup Sequence: K_24 and Sequences Away From the Wild Type pfkelch 3D_7 Strain
.
A Topological View of the Tree Illustrating the Outgroup Sequence: K_24 and Sequences Away From the Wild Type pfkelch 3D_7 Strain
Construction of the Haplotype Network to Establish the Distribution of Haplotypes in the Study Sites
To establish a haplotype network, PopART (version 1.7) was used to show the 7 different haplotypes (Figure 8). Hatch marks were used on the vertices (lines connecting the haplotypes) to demonstrate the number of mutations between the two haplotypes. ‘Hap_1’ was the haplotype with the highest frequency and thus was the largest one. Hap_1 is the oldest haplotype, being more frequent, followed by Hap_3, a descendant of Hap_1. Hap_2 is the descendant of both Hap_1 and Hap_3. In addition, Hap_4, Hap_5, Hap_6, and Hap_7 are descendants of Hap_1.
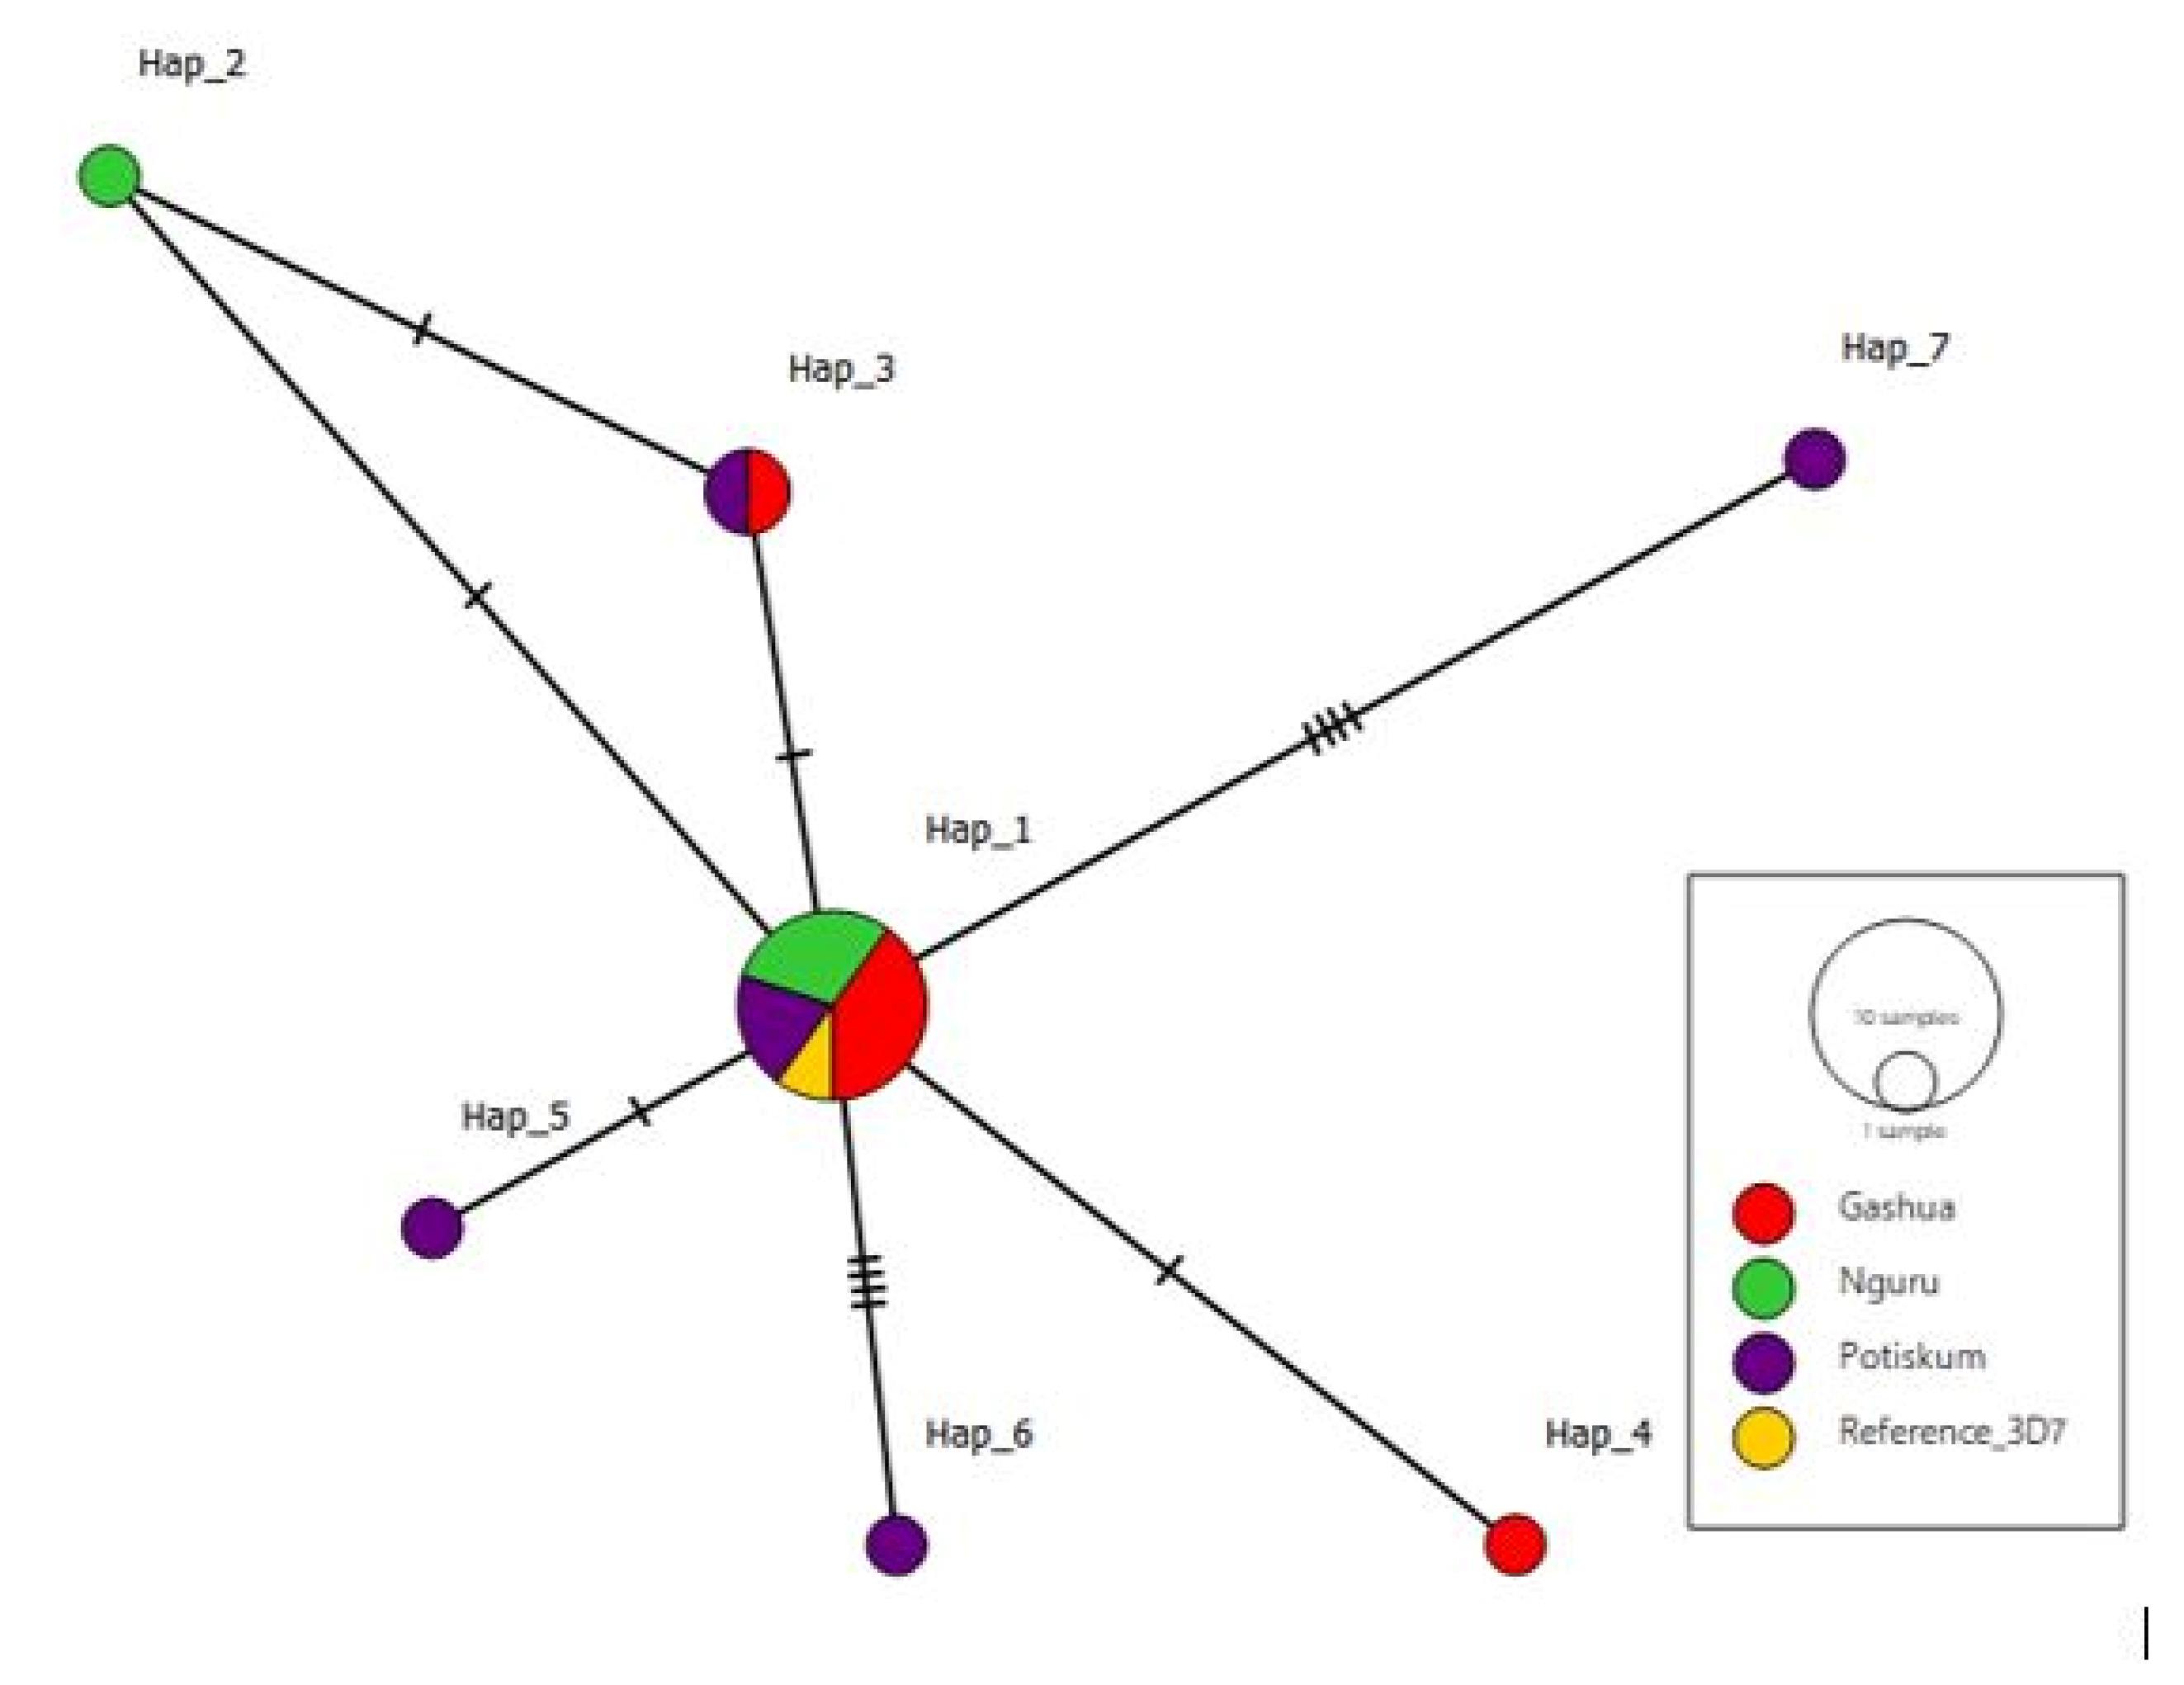
Figure 8.
TCS Haplotype Network of 7 Haplotypes Associated With the Study Sites: Gashua, Nguru, and Potiskum, With Gashua Haplotypes Being Predominant
.
TCS Haplotype Network of 7 Haplotypes Associated With the Study Sites: Gashua, Nguru, and Potiskum, With Gashua Haplotypes Being Predominant
Discussion
Malaria is a dangerous endemic in Africa mainly transmitted by female Anopheles mosquitoes (25). The delayed clearance of the parasite has been documented in several studies, thus indicating the presence of resistance to these antimalarials. A very disturbing fact is the lack of reliable information as well as a broad mechanism of resistance, subsequently hindering proper control and eradicating measures.
To tackle this issue, in this study, the molecular surveillance of the Kelch gene provided a workable explanation of the possible mechanism for this delayed parasite clearance associated with ACT drugs in the blood sample of patients suffering from malaria in Yobe State, Nigeria. This research established 9 novel mutations at codons (GAA- GTA, AGT-AGC, AGT – AGG, GAT – CAT, GCT – GCG, GAG – CAG, TCA- TTA, CAT – TAT, TGG – ATG). Of the 9 mutations, 7 were NS (E461V, S485R, D648H, E668Q, S679L, H697Y, and W706M), and 2 were synonymous (S485S and A675A).
The S485S synonymous mutation appeared on both K_4 and K_27. It is a silent mutation that does not change the composition of the amino acid Serine (S). However, on K_20 at the same locus, there was a change in amino acid from Serine (S) to Arginine (R). The other synonymous mutation, A675A, appeared on K_24. There was also no change in the amino acid composition of Alanine (A). Sequence K_24 could record the most mutations, singly harboring 4 mutations, including one synonymous (A675A) and three NS (D648H, S679L, and H697Y).
No mutation was found on BTB/POZ sequences in this study, which conforms to the results of several studies, indicating that ACT resistance is often limited to the pfKelch13 propeller domain. However, there is a strong claim that ACT resistance can occur due to mutations in the BTB/POZ domain (26).
Efforts spared to understand the pattern of resistance mainly via molecular surveillance are geared toward monitoring and reporting the emergence and spread of new resistance markers (25). The pfKelch13 validated markers include F446I, N458Y, M476I, Y493H, R539T, I543T, P553L, R561H, P574L, and C580Y. Recently discovered markers such as P441L, G449A, C469F/Y, A481V, R515K, P527H, G538V, V568G, R622I, and A675V are yet to be validated (9,27). In an effort to observe the pattern of P. falciparum resistance to ACT, 9 novel mutations were discovered in this study.
A675V is a Kelch13 mutation that has been reported in Rwanda and Kenya (28). This mutation was nearly similar to the A675A synonymous mutation found on K_24.
Previous research has provided data on various mutations across the continents of Asia, America, and Africa, with a higher frequency of detection in Asia (14). Across Southeast Asia, the emergence and dissemination of mutant PfKelch13 have resulted in widespread treatment failure (8). ACT failure is not always caused by artemisinin resistance alone, and effectiveness rates in Nigeria remain high. On the other hand, resistance exposes the companion medication to the risk of resistance developing to that partner drug as well. This approach could ultimately contribute to a higher rate of ACT failure, as has previously been noted in Southeast Asian countries (29).
Some common African mutations, such as R539T, A671V, N458Y, R561H, and C580Y, are commonly mutated loci in Kenya (8). In Uganda, they included A569S and A578S, with the latter sparingly occurring in Kenya (16). In Ghana, C580V and C580R were respectively reported at the same locus with the major Asian marker, C580Y (9). Not all these WHO-validated mutations were reported in our study. C469C and A578S are the most common mutations associated with Africa. Mutations such as A578S, F442L, N664N, P443A, and Q613N were reported in Nigeria (17).
According to a WHO study in 2021, the use of ACTs increased thirty times worldwide between 2006 and 2013. As a result, it is anticipated that the increased use of ACTs will raise drug pressure and cause resistance to emerge (8,9). The mutations observed in our study may be the result of plasmodium adaptability brought on by selection pressures associated with antimalarial drug usage in Africa, including the use of counterfeit drugs, failure to comply with medical advice, and presumed malaria therapy.
In turn, the danger of resistance development may be increased by the inappropriate application of ACTs in conjunction with counterfeit medications in developing nations such as Nigeria. It is feasible that the artemisinin resistance reported in Cambodia would also travel from Myanmar to India to Africa by following the prior patterns of resistance previously discovered in Southeast Asia and subsequently extended to Africa.
To establish evolutionary distance (differences between the sequences in terms of changes in amino acids), DnaSP was used to compute haplotype frequencies; overall, 10 sequences had the same haplotypes, with Hap_1 (K_10, K_28, K_13, K_5, K_18, K_1, K_29, K_9, K_22, and 3D7) indicating no differences within the sequences, followed by Hap_3 (K_4 and K_27) that had a negligible distance from the ‘Hap_1’ group sequences. All other haplotypes are one each. Meanwhile, they singled out the ‘Hap_1’ and ‘Hap_3’ sequences and therefore distantly away from them (Figure 8).
To further reveal recent evolutionary lineages between the ‘K sequences’, a graphical representation of the haplotype network (Figure 8) shows the predominant haplotype to be ‘Hap_1’, and likely from which other haplotypes descend, followed by ‘Hap_3’.
The genetic diversity parameters obtained in this study indicated non-severe mutations. The absence of the WHO-validated markers may suggest that ACTs are reliable treatment agents in Yobe, Nigeria. However, there are not enough studies on molecular surveillance in Nigeria. Antimalarial drug resistance can be theorized and discussed with elaborate mutation models only when adequate data are collected by interested researchers.
Conclusion
In general, P. falciparum parasites were high in the blood samples of patients from the three different hospitals in Yobe State that were subjected to the RDT malarial strip test and the Giemsa microscopy protocol. The presence of the parasites was also confirmed in some samples that were subjected to downstream molecular analysis.
Similarly, the Kelch13 gene was identified and analyzed for the presence of SNPs using in-silico tools. There were two synonymous and seven NS mutations.
It is noteworthy that the mutations observed in this study are not yet validated by the WHO and therefore cannot be declared as validated markers for ACT resistance, at least not yet until similar markers have been discovered by other studies. Hence, their epidemiologic impact can not be determined, suggesting that ACTs are still reliable in Yobe State.
Authors’ Contribution
Conceptualization: Abdulhamid Abubakar Zubair, Umar Faruk Abubakar, and Muhammad Ribadu Bashir.
Data curation: Abdulhamid Abubakar Zubair, Muttaka Auwalu, Simdung Wuriba Kopdorah, and Sagir Adamu Barde.
Formal analysis: Abdulhamid Abubakar, Umar Faruk Abubakar, Karderam Bukar Dikwa, and Muhammad Ribadu Bashir.
Funding acquisition: Abdulhamid Abubakar and Amina Yusuf Bulama.
Investigation: Abdulhamid Abubakar, Gabriel Adegboyega Ajibade, Ali Ahmed Haroun, and Amina Yusuf Bulama.
Methodology: Gabriel Adegboyega Ajibade, Abdulhamid Abubakar, Umar Faruk Abubakar, Muttaka Auwalu, and Sagir Adamu Barde.
Resources: Umar Faruk Abubakar, Gabriel Adegboyega, and Sagir Adamu Barde.
Project administration: Gabriel Adegboyega Ajibade, Ali Ahmed Haroun, Karderam Bukar Dikwa, and Abdulhamid Abubakar.
Software: Umar Faruk Abubakar, Muhammad Ribadu Bashir, and Simdung Wuriba Kopdorah.
Supervision: Gabriel Adegboyega Ajibade, Ali Ahmed Haroun, and Karderam Bukar Dikwa.
Validation: Gabriel Adegboyega Ajibade, Ali Ahmed Haroun, and Karderam Bukar Dikwa.
Visualisation: Gabriel Adegboyega Ajibade, Ali Ahmed Haroun, and Karderam Bukar Dikwa.
Writing-original draft: Abdulhamid Abubakar Zubair.
Writing-review and editing: Abdulhamid Abubakar Zubair and Karderam Bukar Dikwa.
Competing Interests
None declared.
Ethical Approval
This research strictly adhered to Helsinski’s Declaration. Clearance to conduct the study was collected from the Ministry of Health, Yobe State (with reference number MOH/off/ 797/TI/567). All participants gave their consent to cooperate throughout the study.
Funding
The research was self-funded.
References
- Imam AA, Shehu A, Khalil IA, Abdullahi H. Phytochemistry and in vitro antiplasmodial properties of aqueous and ethanol stem bark extracts of Jatropha curcas (physic nut). Bayero J Pure Appl Sci 2017; 10(2):159-66. doi: 10.4314/bajopas.v10i2 [Crossref] [ Google Scholar]
- Sinha S, Medhi B, Sehgal R. Challenges of drug-resistant malaria. Parasite 2014; 21:61. doi: 10.1051/parasite/2014059 [Crossref] [ Google Scholar]
- López C, Saravia C, Gomez A, Hoebeke J, Patarroyo MA. Mechanisms of genetically-based resistance to malaria. Gene 2010; 467(1-2):1-12. doi: 10.1016/j.gene.2010.07.008 [Crossref] [ Google Scholar]
- Xu S, Roth AE, Udenze KO, Luque RT, Santiago L, Barnes S. Humanized mouse model of Plasmodium falciparum infection in blood stage. Am J Trop Med Hyg 2015; 93(4):60. [ Google Scholar]
- Foguim FT, Robert MG, Gueye MW, Gendrot M, Diawara S, Mosnier J. Low polymorphisms in PfACT, PfUGT and PfCARL genes in African Plasmodium falciparum isolates and absence of association with susceptibility to common anti-malarial drugs. Malar J 2019; 18(1):293. doi: 10.1186/s12936-019-2919-3 [Crossref] [ Google Scholar]
- Laminou I, Lamine M, Mahamadou B, Ascofaré O, Dieye A. Polymorphism of PfK13-propeller in Niger: detection of novel mutations. J Adv Med Med Res 2017; 22(5):1-5. doi: 10.9734/jammr/2017/34192 [Crossref] [ Google Scholar]
- Miotto O, Sekihara M, Tachibana SI, Yamauchi M, Pearson RD, Amato R. Emergence of artemisinin-resistant Plasmodium falciparum with Kelch13 C580Y mutations on the island of New Guinea. PLoS Pathog 2020; 16(12):e1009133. doi: 10.1371/journal.ppat.1009133 [Crossref] [ Google Scholar]
- Maniga JN, Samuel M, John O, Rael M, Muchiri JN, Bwogo P. Novel Plasmodium falciparum K13 gene polymorphisms from Kisii county, Kenya during an era of artemisinin-based combination therapy deployment. Malar J 2023; 22(1):87. doi: 10.1186/s12936-023-04517-2 [Crossref] [ Google Scholar]
- Matrevi SA, Tandoh KZ, Bruku S, Opoku-Agyeman P, Adams T, Ennuson NA. Novel PfK13 polymorphisms in Plasmodium falciparum population in Ghana. Sci Rep 2022; 12(1):7797. doi: 10.1038/s41598-022-11790-9 [Crossref] [ Google Scholar]
- Abubakar UF, Adam R, Mukhtar MM, Muhammad A, Yahuza AA, Ibrahim SS. Identification of mutations in antimalarial resistance gene Kelch13 from Plasmodium falciparum isolates in Kano, Nigeria. Trop Med Infect Dis 2020; 5(2):85. doi: 10.3390/tropicalmed5020085 [Crossref] [ Google Scholar]
- Ndong Ngomo JM, Mawili-Mboumba DP, M’Bondoukwe NP, Nikiéma Ndong Ella R, Bouyou Akotet MK. Increased prevalence of mutant allele pfdhps 437G and pfdhfr triple mutation in Plasmodium falciparum isolates from a rural area of Gabon, three years after the change of malaria treatment policy. Malar Res Treat 2016; 2016:9694372. doi: 10.1155/2016/9694372 [Crossref] [ Google Scholar]
- Lucchi NW, Abdallah R, Louzada J, Udhayakumar V, Oliveira-Ferreira J. Molecular surveillance for polymorphisms associated with artemisinin-based combination therapy resistance in Plasmodium falciparum isolates collected in the state of Roraima, Brazil. Am J Trop Med Hyg 2020; 102(2):310-2. doi: 10.4269/ajtmh.19-0749 [Crossref] [ Google Scholar]
- Putaporntip C, Kuamsab N, Kosuwin R, Tantiwattanasub W, Vejakama P, Sueblinvong T, et al. Natural selection of K13 mutants of Plasmodium falciparum in response to artemisinin combination therapies in Thailand. Clin Microbiol Infect 2016;22(3):285.e1-8. 10.1016/j.cmi.2015.10.027.
- Zaw MT, Emran NA, Lin Z. Updates on K13 mutant alleles for artemisinin resistance in Plasmodium falciparum. J Microbiol Immunol Infect 2018; 51(2):159-65. doi: 10.1016/j.jmii.2017.06.009 [Crossref] [ Google Scholar]
- World Health Organization. International travel and health: chapter 7 - malaria. https://www.who.int/publications/m/item/international-travel-and-health--chapter-7---malaria.
- Osoti V, Akinyi M, Wamae K, Kimenyi KM, de Laurent Z, Ndwiga L. Targeted amplicon deep sequencing for monitoring antimalarial resistance markers in western Kenya. Antimicrob Agents Chemother 2022; 66(4):e0194521. doi: 10.1128/aac.01945-21 [Crossref] [ Google Scholar]
- Kong X, Feng J, Xu Y, Yan G, Zhou S. Molecular surveillance of artemisinin resistance-related PfK13 and pfcrt polymorphisms in imported Plasmodium falciparum isolates reported in eastern China from 2015 to 2019. Malar J 2022; 21(1):369. doi: 10.1186/s12936-022-04398-x [Crossref] [ Google Scholar]
- Garba J, Faleke OO, Magaji AA, Alkali RB, Nwankwo IO, Dzikwi AA. Prevalence of rotavirus A infection and the detection of type G3P[11] strain in ruminants in Yobe state, Nigeria. Trop Anim Health Prod 2020; 52(6):2905-15. doi: 10.1007/s11250-020-02291-w [Crossref] [ Google Scholar]
- Cheesbrough M. District Laboratory Practice in Tropical Countries. Cambridge, UK: Cambridge University Press; 2009.
- Echeverry DF, Deason NA, Davidson J, Makuru V, Xiao H, Niedbalski J. Human malaria diagnosis using a single-step direct-PCR based on the Plasmodium cytochrome oxidase III gene. Malar J 2016; 15:128. doi: 10.1186/s12936-016-1185-x [Crossref] [ Google Scholar]
- Hall TA. BioEdit: a user-friendly biological sequence alignment editor and analysis program for Windows 95/98/NT. Nucleic Acids Symp Ser (Oxf) 1999; 41:95-8. [ Google Scholar]
- Librado P, Rozas J. DnaSP v5: a software for comprehensive analysis of DNA polymorphism data. Bioinformatics 2009; 25(11):1451-2. doi: 10.1093/bioinformatics/btp187 [Crossref] [ Google Scholar]
- Tamura K, Stecher G, Peterson D, Filipski A, Kumar S. MEGA6: molecular evolutionary genetics analysis version 60. Mol Biol Evol 2013; 30(12):2725-9. doi: 10.1093/molbev/mst197 [Crossref] [ Google Scholar]
- Clement M, Snell Q, Walke P, Posada D, Crandall K. TCS: estimating gene genealogies. In: Proceedings 16th International Parallel and Distributed Processing Symposium. IEEE; 2002. p. 7. 10.1109/ipdps.2002.1016585.
- Idowu AO, Bhattacharyya S, Gradus S, Oyibo W, George Z, Black C. Plasmodium falciparum treated with artemisinin-based combined therapy exhibits enhanced mutation, heightened cortisol and TNF-α induction. Int J Med Sci 2018; 15(13):1449-57. doi: 10.7150/ijms.27350 [Crossref] [ Google Scholar]
- Paloque L, Coppée R, Stokes BH, Gnädig NF, Niaré K, Augereau JM. Mutation in the Plasmodium falciparum BTB/POZ domain of K13 protein confers artemisinin resistance. Antimicrob Agents Chemother 2022; 66(1):e0132021. doi: 10.1128/aac.01320-21 [Crossref] [ Google Scholar]
- Watson OJ, Gao B, Nguyen TD, Tran TN, Penny MA, Smith DL. Pre-existing partner-drug resistance to artemisinin combination therapies facilitates the emergence and spread of artemisinin resistance: a consensus modelling study. Lancet Microbe 2022; 3(9):e701-10. doi: 10.1016/s2666-5247(22)00155-0 [Crossref] [ Google Scholar]
- Diallo MA, Yade MS, Ndiaye YD, Diallo I, Diongue K, Sy SA. Efficacy and safety of artemisinin-based combination therapy and the implications of Pfkelch13 and Pfcoronin molecular markers in treatment failure in Senegal. Sci Rep 2020; 10(1):8907. doi: 10.1038/s41598-020-65553-5 [Crossref] [ Google Scholar]
- van Loon W, Oliveira R, Bergmann C, Habarugira F, Ndoli J, Sendegeya A. In vitro confirmation of artemisinin resistance in Plasmodium falciparum from patient isolates, southern Rwanda, 2019. Emerg Infect Dis 2022; 28(4):852-5. doi: 10.3201/eid2804.212269 [Crossref] [ Google Scholar]